
This story was co-published with WNYC Radio.
When Patrice and Philip Morgan bought a house near the ocean in Brooklyn, they were not particularly worried about the threat of flooding.
Federal maps showed their home was outside the area at a high risk of flood damage. For that reason, the government did not require them to buy flood insurance, a cost imposed on neighbors on more vulnerable blocks.
Even so, the couple decided to raise their house four feet to protect their basement from the effects of heavy rain storms.
“We thought we might have a foot or two of water,” Patrice said, “so we put a sump pump in to avoid any small issues.”
But the maps drawn up by the Federal Emergency Management Agency were wrong. And government officials knew it.
According to documents and interviews, state, local and federal officials had been aware for years that the crucial maps of flood risks were inaccurate; some feared they understated the dangers in New York City’s low-lying areas.
The flaws in the maps had significant impact. Developers relied on FEMA’s assessment of risks when they built new homes near the water. And homeowners and businesses made crucial decisions about where to buy or lease property on the assurance that they were outside of the high-risk zones.
Thousands of the buildings incorrectly identified as outside the flood zone were damaged when seawater surged ashore as Hurricane Sandy made landfall on Oct. 29, 2012.
State and city officials had been asking FEMA for years to revise the maps with technology and modeling methods that didn’t exist when they were first drawn in the 1980s. William S. Nechamen, New York State’s floodplain chief, warned FEMA in a 2005 letter that the failure to do so “will lead to higher than necessary flood damages and more expenses placed on individuals and on FEMA.”
Yet, despite Nechamen’s warning, FEMA missed chances to make changes that could have protected city dwellers from some of the worst of Sandy’s destruction.
During a push to modernize flood maps in the mid-2000s, FEMA decided to save money in New York City and much of the rest of the country by digitizing old flood maps without updating the underlying information, rather than using new technology to create more accurate maps.
The agency changed course in 2006, but didn’t release maps with better elevation data and more accurate storm-surge models until months after Sandy – too late to help New Yorkers like the Morgans.
When FEMA finally released a preliminary version of those maps this January they showed that the number of city structures considered at high risk of flooding had doubled. More than 35,000 additional homes and businesses were added to the map’s riskiest zones, according to a study by New York City’s Office of Long-Term Planning and Sustainability. Some 9,503 of those buildings suffered damaged during Sandy, a ProPublica analysis of flood maps shows.
FEMA did not respond to specific questions about the adequacy of its flood maps or glitches in the modernization process. Bill McDonnell, the deputy director for mitigation for FEMA’s Region II, acknowledged that no new data had been collected to update maps for New York or New Jersey in the mid-2000s. In a statement, the agency said it began giving priority to map updates for “high-risk, coastal areas” in 2009. These included 14 counties in New Jersey and New York City. The agency said it continues to work with state and local officials to “incorporate the best available data into maps.’’
That didn’t help the Morgans. Their home, a 1920s bungalow to which they added a second floor, was hit hard by Hurricane Sandy.
“The whole basement was destroyed,” said Patrice Morgan, a professor at Kingsborough Community College who was pregnant with her third child when Sandy arrived. “We had to rip out four feet of our walls, replace all of our appliances.”
The family spent more than five months at Patrice’s parents’ house in Bensonhurst before they could move back in. The Morgans received $17,000 from FEMA and $6,000 from their homeowners’ insurance, but spent nearly $50,000 out-of-pocket to rebuild their home.
The error in calculating the Morgans’ flood risk was substantial. The map that existed when they bought the house in 2008 predicted that floodwaters would rise less than a foot even in rare storms, those with a 1 percent chance of occurring in any year. The new maps predict floodwaters 11 feet deep for that block under those conditions.
Philip Orton, an oceanographer at the Stevens Institute of Technology who worked as a technical reviewer on the new maps, said most of the difference can be accounted for by more accurate mapping data and technology. Rising sea levels due to climate change accounts for no more than six inches of the increase, Orton said.
If they’d known in 2008 what they know now, Philip Morgan said, the house’s entire layout would be different.
“Our utilities are in the basement,” he said. “We would have moved that to a higher floor. Higher, that’s the key.”
FEMA’s sputtering effort to update its flood maps dates back about a decade.
The maps serve several crucial functions. Beyond helping to set standards for development in areas considered high-risk, they determine the rates homeowners pay for insurance through the National Flood Insurance Program. Homeowners with federally backed mortgages in high-risk flood zones — where the annual chance of flooding is estimated at 1 percent or higher — are required by law to purchase flood insurance.
Until 2003, FEMA had been using mostly paper maps drawn in the 1970s and ‘80s. That year, at the urging of floodplain administrators, Congress passed legislation allocating about $1 billion -- $200 million a year for five years -- to update and digitize the nation’s flood maps.
But David Maurstad, who ran the flood insurance program from 2004 to 2008, said he told the White House’s Office of Management and Budget early in his tenure that the money authorized wouldn’t come close to covering the cost of updating all the maps.
“I indicated to them that I want to make sure you understand that this is a down payment — less than a third of the maps are going to get new engineering,” he said.
New engineering was crucial because modern technologies are capable of producing far more accurate maps. Lidar, which is collected by airplanes that shoot laser pulses at the ground, can detect differences in ground elevation of as little as 3 inches and produces data that’s 10 times as accurate as that used to generate earlier maps. And computer programs such as ADCIRC can model storm surge and wave action with far greater accuracy.
“There can be massive under-predictions with the old technology,” said Joannes Westerink, an engineering professor at the University of Notre Dame and a co-developer of ADCIRC, “simply because it wasn’t representing the physics right.”
But updating maps with new engineering isn’t cheap.
When FEMA started updating New York City’s maps in 2003, it used elevation data from the old maps and matched it up with modern satellite imagery “in order to stretch the mapping budget," said Lisa King, a spokeswoman for the New York State Department of Environmental Conservation.
The result: Digital maps that weren’t much more accurate than the paper ones they replaced.
City and state officials weren’t happy.
New York City specifically requested that FEMA gather lidar data for its new maps and was rebuffed, according to a city official who requested not be named.
“The City had serious concerns about the accuracy of this data,” the official said in an email to ProPublica, “and stated this in numerous meetings and then in a formal letter to FEMA.”
Nechamen, the state floodplain chief, called FEMA’s strategy “misguided and counterproductive” in his 2005 letter to Maurstad at FEMA.
“This is insufficient and will result in poor quality, but really good looking maps that fail to provide the data needed to adequately manage development in floodplains,” he wrote. “Many errors on existing maps will continue to appear on the new maps.”
Nechamen referred requests for comment to the New York State Department of Environmental Conservation, which did not respond to requests to make him available for an interview.
In an interview, Maurstad said he had received similar complaints from officials from other states as well.
“This is consistent with what many of the state folks were expressing at the time,” he said.
As a result, in 2006, FEMA changed its flooding-mapping strategy in what it called a “midcourse adjustment,” which called for producing digital maps for about 92 percent of the country, rather than the whole nation. The agency said it would use the money it saved to increase slightly the number of areas that got new engineering.
But New York City’s flood maps didn’t get much new engineering — not new storm-surge analyses or lidar elevation data.
Some states saw the need for better maps as so urgent that they took it upon themselves to gather the data. North Carolina decided to pay for mapping the state using lidar after Hurricane Floyd in 1999. “We were concerned at the time that FEMA didn’t have the money,” said John Dorman, the director of the North Carolina Floodplain Mapping Program.
Other parts of New York had more accurate data than New York City. The maps for Nassau and Suffolk counties on Long Island, finalized in 2009, had been drawn using lidar and new storm-surge models. (Much of that data had been gathered by the Army Corps of Engineers.)
It made a huge difference when Sandy struck. According to ProPublica’s analysis, 75 percent of the flooded area in Suffolk County and 89 percent of the flooded area in Nassau County fell within the high-risk zones on the new maps.
No map, of course, can predict all the idiosyncrasies of a particular storm, a FEMA specialist told ProPublica.
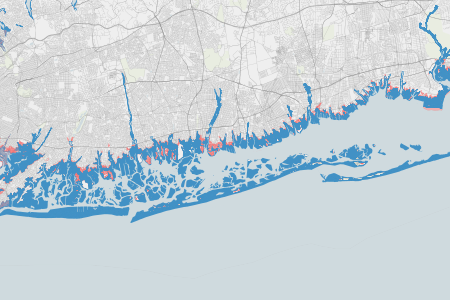
But maps for Brooklyn and Queens, the city’s hardest-hit boroughs, predicted Sandy’s flooding far less reliably. Only 47 percent of the flooded area in Brooklyn and 54 percent of the flooded area in Queens was in the area considered high-risk. (See our interactive news application to explore how coastal New York and New Jersey counties rank at predicting Sandy’s surge. See our methodology for more about how we analyzed the flood map data.)
Queens
54%Of Sandy flood area predicted by flood maps
Kings
47%Of Sandy flood area predicted by flood maps

Nassau
89%Of Sandy flood area predicted by flood maps
FEMA started updating New York City’s maps again in 2009, only two years after the previous flood maps had been released. This time they undertook a new storm-surge analysis and included lidar data that the city itself spent $450,000 to gather in 2010. (The effort was partly financed with a grant from the U.S. Department of Energy.)
But these maps weren’t ready in time for Sandy, a delay that carried a high price.
Nearly 400 of the buildings that suffered damage during Sandy had been built or modified since 2007, when the less-accurate maps came out, ProPublica’s analysis showed. Those buildings weren’t included in high-risk flood zones; now they are.

Rita Brummer poses for a portrait with her Shih Tzu, Coco Chanel, at her home in the Rockaways on Monday afternoon. In the background, a worker removes siding from the house. Brummer and Steven Farrara are still working on their home more than a year after it was flooded by Superstorm Sandy. The pair dropped their flood insurance coverage less than a year before the storm, when they were told their property did not fall into the high-risk flood zone. (Karsten Moran for ProPublica)
Rita Brummer and Steven Ferrara, who live in the Belle Harbor neighborhood in Queens, paid flood insurance premiums for more than 20 years before they dropped their coverage less than a year before Sandy flooded their home. On the 2007 maps, their home wasn’t in a high-risk flood zone.
“Nobody believed the storm was going to hit us like this,” Brummer said.
The surge of salt water and sewage that flooded their home caused more than $100,000 in damage, much of which the couple paid to repair themselves. On the updated maps released this year, their house was in a high-risk zone. Had she known that sooner, Brummer said, she “never would have dropped” her flood insurance.
More than 100 other homes that suffered damage in Belle Harbor also did not fall into the high-risk flood zone on the old flood maps but are considered high-risk on the maps released this year.
Those maps are in the process of being refined further. In the weeks after the storm, FEMA rushed to release incomplete “advisory” versions, then issued more complete updates this January. The maps are expected to be finalized in 2015.
Imperfect as they remain, New York City’s flood maps are more advanced than those covering some other parts of the country. Five coastal counties in New Jersey still use paper maps dating back decades. FEMA has been in the process of revising New Orleans’ maps since the Army Corps shored up the city’s flood protection after Hurricane Katrina in 2005, and still officially relies on paper maps from 1984.
Though the federal government approved more than $60 billion in aid after Hurricane Sandy, including a $9.7 billion increase in the National Flood Insurance Program’s borrowing limit, it has actually cut spending on flood mapping in recent years. Congress allocated $99 million for updating maps in 2012, roughly half of what it had spent annually since 2004. About the same amount was allocated for this year.
In a report released in March, the Association of State Floodplain Managers estimated the total cost of updating flood maps nationwide at $4.5 billion to $7.5 billion. It also estimated that the maps, even in their current state, save the country about $1 billion a year in flood-related damages.
Chad Berginnis, the association’s executive director, said that the absence of accurate flood maps could lead to an “entire cascade of impacts”: higher costs to taxpayers in the form of disaster assistance, higher likelihood of injury and death for residents, lost tax revenue and damaged infrastructure after flooding occurs.
“All of those typical effects are things that happen when you don’t have good, accurate flood data that you’re using,” he said.


