
We wrote last week about Democratic volunteers in Minnesota who feed information about their neighbors into the party’s voter database.
The data points they collect — like the campaign lawn sign in front of a voter’s house, or a political opinion shared in a letter to the editor — are saved from one election cycle to the next, and often shared with the Democratic National Committee.
These little pieces of information may not seem particularly useful on their own. But taken together, they can be quite telling.
Minnesota voters do not register with a political party, so there’s no easy way to tell a Democrat from a Republican from public voter data. But using the information they collect in their database, Minnesota’s Democratic-Farmer-Labor party can get a clear view of both their supporters and their opponents.
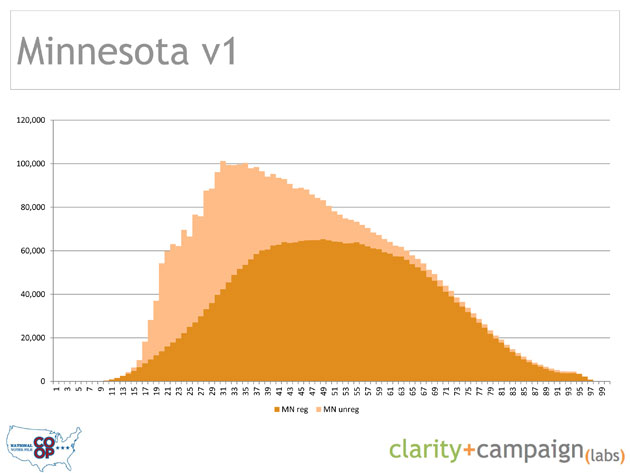
Here’s a graph of the political orientation of Minnesota voters, produced by Clarity Campaign Labs, a Democratic firm, this past summer. The graphs show voters’ estimated political leanings, on a scale of 1 (strong Republican) to 100 (strong Democrat), according to Tom Bonier, the company’s co-founder.
This graph was made using public voter data, consumer data, and demographic information. Without any party registration data, most Minnesota voters appear to be lumped together in the middle of the political spectrum.
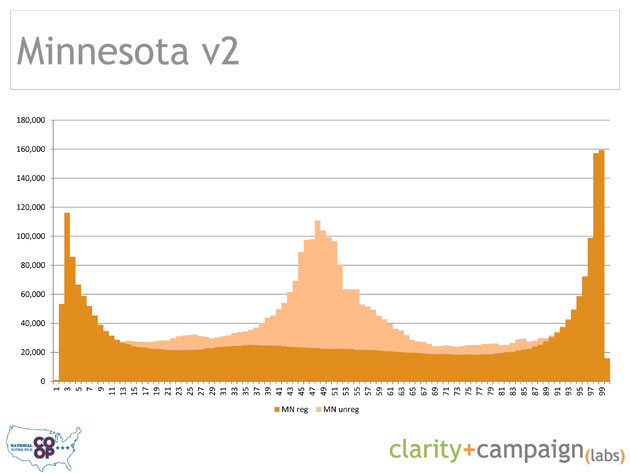
Then Clarity crunched the numbers again—this time working using the voter information Minnesota’s Democratic volunteers had painstakingly collected over more than two decades.
In this new graph, most of those middle-of-the-road voters disappeared. Instead, the state’s citizens are sorted into two tall columns of strong Republicans and strong Democrats.
(The lighter-orange spike in the middle of this graph represents Minnesota residents who are not registered to vote; their leanings are still difficult to categorize.)
The contrast between these two graphs showed Minnesota Democrats how well their investment in data collection has paid off. In a closely divided state, they can use their database to pinpoint potential supporters and avoid spending money or volunteer hours trying to reach voters who are likely to be conservative.
Even in states where campaigns can contact voters based on their official party registration, a data collection strategy can still be useful. Gathering information about voters can help campaigns make an educated guess about the political leanings of registered independents. It can also help Democrats figure out whether a registered GOP voter is a strong Republican, who is unlikely to change her mind, or a weak Republican, who might vote for a Democrat in certain situations.
In conservative Utah, most voters are Republicans. Public voter data revealed few people who were likely Democrats.

But using data gathered by the Utah Democratic Party, Clarity Campaign Labs was able to surface a larger group of voters—including some registered independents—who were very likely to vote Democratic.
Some voters in this group may have been directly identified through records of political donations or conversations with Democratic volunteers, Bonier said. Others are “look-alikes,” meaning that Clarity analyzed the characteristics of the known supporters to project others who were very likely to be Democrats.
In his slideshow of the graphs, Bonier noted that the Utah example proved that “there is tremendous value in organized data collection efforts even if you’re not in a traditional battleground.”

In order to calculate the political leanings of voters across the nation, Clarity Campaign Labs plugged in public voter and demographic information about individual citizens in all 50 states, and used these data points, weighted in different ways, to assign each person a political score.
These scores represent the probability of a certain person being a Republican or a Democrat— which means that even a voter who is assigned a political partisanship score marking them as a Democrat might actually turn out to be a staunch Republican.
Assigning voters these kinds of political scores is common: Obama’s 2012 campaign calculated several different scores for each swing state voter, including an estimate of how persuadable they might be. Americans for Prosperity, a conservative group, also scored voters on their likelihood of supporting tax and spending cuts, The Guardian reported.


