
Visual Evidence looks at the ways design and data visualization can create or solve real-world problems, from making weather warnings easier to read to finding meaning on the bottom of our shoes. This week, we’ll transform some data on an everyday — some might even say, pedestrian – topic into a more visual and interactive form.
No really, it’s data on actual pedestrians.
The following chart shows how likely you are to be killed if you are a pedestrian hit by a car traveling at various speeds.
The data used to create this interactive chart comes from Brian Tefft, a researcher at the AAA Foundation for Traffic Safety. He sent me the data from his 2011 report titled “Impact Speed and a Pedestrian’s Risk of Severe Injury or Death.” In the report, he estimates the risk of severe injury or death using data from a federal study of car crashes from 1994–1998. Here are the original charts:
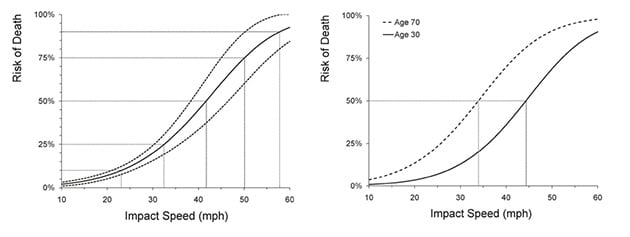
While it might be common sense that faster cars are deadlier, what’s particularly striking to me is how much more deadly they are for older folks. A 70-year-old hit by a car going 35 mph is about as likely to be killed as a 30-year-old hit by a car going 45 mph (in both cases it’s about a 50/50 chance).
That’s the point I wanted to emphasize in the redesigned interactive chart. I’ve plotted the risk curves for 30-year-olds and 70-year-olds together with the average (of all ages). Hovering over the curves at any point now allows you to read the actual percentages more easily, and hopefully makes this age gap more apparent.
Just take a look at 40 mph. A 30-year-old has a 36 percent chance of dying. A 70-year-old’s chance is almost double that, at 70 percent. Of course these percentages are rough — they are estimates based on a sample of data. But the trend is clear: Age makes a huge difference.
The second main point is that once cars reach a certain speed (just above 20 mph), they rapidly become more deadly. According to Tefft's data, a person is about 70 percent more likely to be killed if they’re struck by a vehicle traveling at 30 mph versus 25 mph.
If you live in New York City, those two numbers may sound familiar. That’s because in the fall of 2014, Mayor Bill de Blasio signed a law lowering the default city speed limit from 30 mph to 25 mph. Speed limits are just one part of Vision Zero, a citywide initiative to create safer streets for all New Yorkers, who are seriously injured or killed by cars at a rate of one person every two hours. And there is some evidence that the initiative is working — 2015 saw the fewest traffic deaths recorded in NYC for any year since 1910 (a total of 231 deaths, 134 of which were pedestrians).
While some people see the speed limit adjustments as a traffic-slowing nuisance, for those who get hit, it could actually make a huge difference in how likely they are to survive.
“Indeed, the risk [of death] increases dramatically between 20–40 mph,” said Tobias Niebuhr in an email. Niebuhr’s a statistician at the University of Hamburg who studies pedestrian injury risk. He recently published a paper on how older people are much more likely to suffer serious injuries or be killed at all collision speeds.
Keep in mind that many of these estimates are based on small sample sizes (in the Tefft report, a group of 422 pedestrians) and may skew toward over-representing severe and fatal accidents. Furthermore, your risk of injury or death depends on all sorts of other things, like the size of the car, how much you weigh, from what angle you get hit, etc.
But other studies have shown similar trends in how much speed matters. In 2010 London’s Department for Transport reviewed the literature on impact speed and pedestrian safety and concluded that “the risk of fatality increases slowly until impact speeds of around 30 mph. Above this speed, risk increases rapidly — the increase is between 3.5 and 5.5 times from 30 mph to 40 mph.”
Of course, merely changing the speed limit doesn’t mean that all cars will suddenly start driving slower. Besides better signage and enforcement, the design of intersections and streets themselves can also reduce speed. Take lane width. Here’s a chart from The National Association of City Transportation Officials Urban Street Design Guide that illustrates how much faster cars go when they have wider space to drive in: about 9 mph faster for every 3 feet wider.

See this historical account from FiveThiryEight on the many factors that influence how fast people drive.
Speed limits aren’t everything when it comes to preventing pedestrians from getting killed by cars (let’s not even start on texting while driving). But this interactive chart makes it easier to see the difference a few miles per hour can make. Consider that the next time you’re behind the wheel cursing your longer commute time. A few minutes to you could mean survival to somebody else.


