Methodology: How We Tested an Aggression Detection Algorithm
An in-depth look at software that claims to spot aggression from your voice
by Jeff Kao and Jack Gillum
Introduction
This companion article to our main story describes the testing and data analysis ProPublica conducted for the Sound Intelligence aggression detection algorithm on the Louroe Digifact A microphone. Here, we discuss the data and methodology used for our research, as well as the results of our testing and analysis. Those results raise concerns about the device, particularly for the school environments for which it is marketed and sold.
We first tested the device in simulated situations to measure its performance in real-world scenarios and collected spontaneous and simulated vocalizations from high school students. We then analyzed the types of sounds that the algorithm found to be aggressive and determined, for those sounds, some common audio characteristics. We view this analysis as an initial exploration of the algorithm, using sound it would likely encounter in operation, rather than a definitive evaluation.
Summary of Results
Our testing and analysis found:
- The algorithm frequently produced false positives (false findings of aggression) for sounds such as laughing, coughing, cheering and loud discussions.
- Certain types of screaming that we expected to trigger the algorithm, in particular high-pitched shrieking, often failed to do so.
- Some individuals we tested, particularly female high school students, tended to trigger false positives while singing, laughing and speaking.
- Anger and aggression expressed quietly, without the markers of voice strain, did not trigger the algorithm.
- The algorithm tends to trigger when a vocalization is higher pitched and contains audio features that generally correspond to a rough vocal tone or vocal strain.
System Description
According to our research, testing and interviews with Sound Intelligence, the Louroe aggression detector includes: 1) a microphone, 2) a sound-processing component that extracts sound features from raw audio input, 3) a machine-learning algorithm that uses those features to predict verbal aggression and 4) a thresholding component that contains settings for the algorithm.
How the Louroe Digifact A works to detect aggression

Dozens of times per second, the software converts the audio signal received by the microphone into audio features. Each set of audio features can be considered a frame of sound and is used to predict whether that segment of the sound input is aggressive. According to our research and interviews with Sound Intelligence, sound volume is not a feature used by the algorithm because it is directly related to the sound’s distance to the microphone, which should not be a factor in determining aggressiveness.
To train the system, Sound Intelligence labeled audio frames of aggressive and non-aggressive events and used those labeled frames as training data for a machine learning classification algorithm. 1 Once trained, the classification algorithm generates a score ranging from 0.0 to 1.0 for each frame based on its audio features. This score represents an overall confidence for identifying aggression — from 0% to 100%. In operation, a confidence exceeding a set threshold over a long enough period of time results in a prediction of aggression by the device.
The device also has threshold settings that are used to fine-tune the algorithm in operation. 2 However, the qualities of sounds that trigger the device are determined in training and set once it is installed on the device. In other words, while fine-tuning changes the device’s behavior, it does not change the types of sounds that the device correlates with inferences of aggression. Lowering the device’s sensitivity merely increases the confidence and time thresholds that must be met in order to raise an alarm. In practice, this may increase the risk of false negatives — cases where the algorithm should trigger but doesn’t. The same type of Sound Intelligence algorithm is used in all of Louroe’s Digifact A microphones, regardless of the environment (e.g., hospitals, schools, prisons, etc.) in which they are installed.
While Sound Intelligence markets its algorithm as detecting aggression, the algorithm actually also seeks to flag instances of vocal distress and strain (e.g., when triggered, the algorithm’s webpage displays the warning “StressedVoice detected”). For the purposes of this document, we term all such triggering vocalizations as “aggressive.”
Testing the System
Our testing aimed to simulate the real-world operating environment for the device as closely as possible. We purchased a Louroe Digifact A microphone and licensed the aggression detection algorithm. We then rewired the device so that, instead of monitoring the surrounding environment, we were also able to input sound directly into the device from any audio recording. This allowed us either to monitor the device’s aggression measurement in real time or test recorded audio clips. Recorded audio was played into the device to reproducibly measure the predicted aggression. 3 We designed a protocol for testing the device's performance on student voices with the assistance of ProPublica data adviser Dr. Heather Lynch. 4
How we tested the Louroe Digifact A

Field Testing
The objective of field testing was to capture, as accurately as possible, how the device would respond to sounds in actual operation.
Data and Methodology
We installed the devices for testing at a height and location in line with a guidance document provided by Sound Intelligence. We recorded sound clips using the Louroe Verifact A — a device with the same microphone sensitivity and frequency response as the Louroe Digifact A but without an onboard aggression detector. (The Digifact contains an onboard Orange Pi device that runs the aggression detector on a pared-down Linux operating system.) This allowed us to collect audio with a microphone having similar frequency response characteristics of the Digifact microphone and in the acoustics of a space where such a device would be deployed. The sound was recorded from the Verifact A in a high-fidelity format. 5
We used this setup to record sound at two high schools: Frank Sinatra School of the Arts in Queens, New York, and Staples Pathways Academy in Westport, Connecticut. We recorded 26 students in two sessions in Queens and 14 students in one session in Westport. The students were 15 to 18 years old.
At each school, we installed the device in the ceiling and recorded students in a common area while they played games such as Pictionary. We also tested and recorded pairs of students in a smaller side room where a device was installed in the ceiling. During this pair testing, the students role-played situations of fear, frustration and anger from comic strips. They also sang unrehearsed songs and attempted to scream in an aggressive manner.
During this pair recording, some of the vocalizations, screaming in particular, were too loud for the Verifact A and distorted its recording — a phenomenon known as “clipping.” This is a potential problem common to any microphone where the sound is too loud or too close to the microphone. To account for this issue, we retested a number of students at a later date in an environment where recorded audio was less likely to be clipped. We then disregarded any pair recordings having substantial clipping.
In total, we recorded more than three hours of sound with the Louroe microphones at the two schools.
Group Testing Results
The algorithm triggered frequently during the approximately two hours of group recording, during which we observed no actual or simulated aggression. A number of different vocalizations triggered the algorithm; including cheering, loud laughter and students shouting out answers. This suggests the algorithm is unable to distinguish between the vocal characteristics associated with enthusiasm and exuberance as opposed to genuine fear or aggression.
Loud discussion sometimes also triggered predictions of aggression.
Since we did not observe any aggression during the group testing, we considered any triggers false positives — inferences of aggressive behavior where there was none. 6 We tabulated the number of such false positives below, organized by the vocalization that triggered the alarm. 7
| Vocalization | Scream or Shout | Laughter | Loud discussion | Cheering | Total 8 |
|---|---|---|---|---|---|
| False Positives | 402 | 43 | 75 | 42 | 565 |
A school setting contains a wide variety of environments and social contexts in which the device is expected to work. While we do not consider this false alarm rate as representative of the frequency of false positives in operation, our group testing results show that the algorithm generates frequent false alarms in a common school scenario.
Pair Testing Results
During our testing with student pairs, we found some instances of laughter, some singing and one student’s coughs triggered the device. There were also many instances of screaming or shouting that did not trigger the device, particularly screams that were high-pitched or that did not contain the markers of voice distortion.
We tabulate below a number of categories of vocalizations. 9
| Laughter | Aggressive Scream or Shout | Non-aggressive Scream or Shout | Singing | Cough | |
|---|---|---|---|---|---|
| Triggered | 16 | 30 | 17 | 3 | 4 |
| Did not Trigger | 38 | 35 | 33 | 13 | 7 |
| Total | 54 | 65 | 50 | 16 | 11 |
During pair testing, the students simulated aggressive and fearful screaming or shouting and were also asked to sing. However, they did not simulate laughter or coughing — those were spontaneous vocalizations recorded during testing. We recognize there may be differences between simulated and actual aggressive shouts and screams, and the aggression detector should only raise an alarm for genuine vocalizations. To account for this, we annotated whether sound clips of screaming were sufficiently aggressive. 10
In our testing data, we found many aggressive sound clips where the device did not respond. We considered such cases to be false negatives. In particular, the device tended to ignore high-pitched screaming.
We also found 27 instances where normal speech falsely triggered the algorithm. 11 In particular, there were two female students whose voices regularly triggered the device while laughing, singing or speaking.
Discussion
Our testing was designed to understand the performance of the algorithm in the field. Given the wide variation among individuals’ voices and the ways that emotional states are vocalized, our testing is neither exhaustive or comprehensive. However, these results do identify apparent weaknesses in the algorithm. We found many instances where the device appeared to make errors, whether by predicting aggression where there was none (false positives) or by failing to trigger when it should have (false negatives).
The high number of false positives combined with false negatives suggests that the device is often unable to differentiate reliably between actual instances of aggression and benign vocalizations. The tendency for the algorithm to mischaracterize events may also lead to fine-tuning that reduces the device’s sensitivity to a level where otherwise aggressive incidents would be overlooked.
Data Analysis
We took a closer look at the clips recorded during the pair testing to learn more about what tends to trigger the algorithm. We examined sound frames in comparison to the algorithm’s measurements of aggression. Similar to the device, we then calculated features for each sound frame. We aggregated the sound features to understand, at a high level, the characteristics of sound considered aggressive by the algorithm.
Analyzing a Frame of Sound
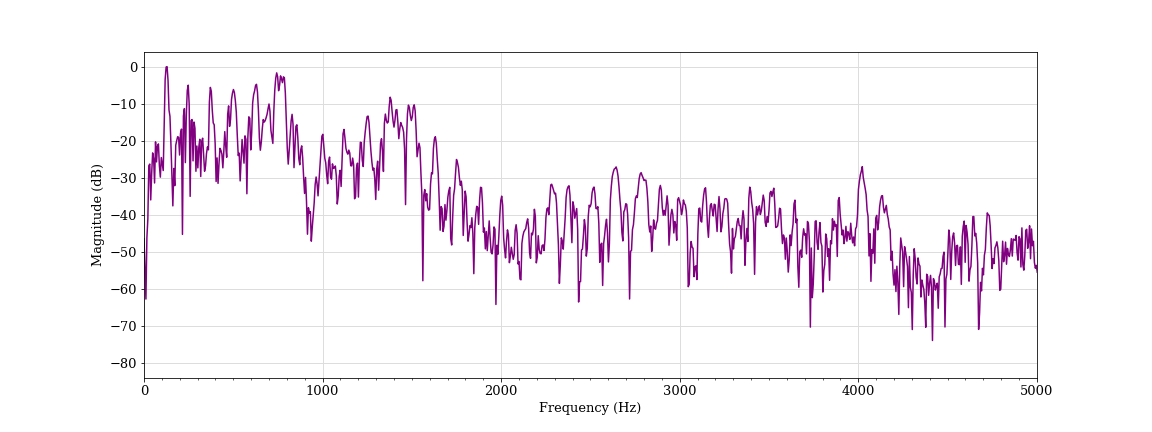
To analyze sound, we start with the individual sound frames that comprise an audio clip. A sound frame can be represented by its raw audio signal (a wave representing sound amplitude over the sound frame) or by calculations on that signal. A representation commonly used in audio analysis is the frequency spectrum — obtained by calculating the raw sound frame’s amplitude at every frequency. Any sound frame can be fully represented in the time domain (the audio signal) or in the frequency domain (the spectrum) and transformed between the two. 12
Representing Sound in the Frequency Domain
A fourier transform converts a signal between its time-domain representation (red) and its frequency domain representation (blue).

The spectra of individual sound frames can be combined over time to produce a visual representation called a spectrogram. A spectrogram plots the frequency components of sound frames over time, which can reveal many details about the sound, such as pitch and tone quality.
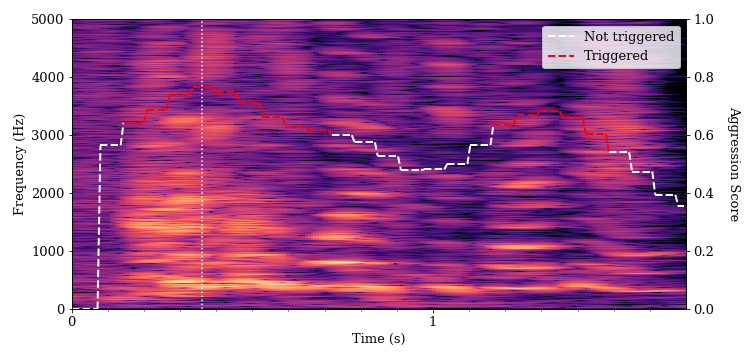
We looked at the spectrograms for a number of different vocalizations to understand what kinds of sound tend to trigger the algorithm. The x-axis is the time of the sound recording, and the y-axis is the frequency component. A brighter area indicates that the magnitude of the frequency component at that time is higher. 13
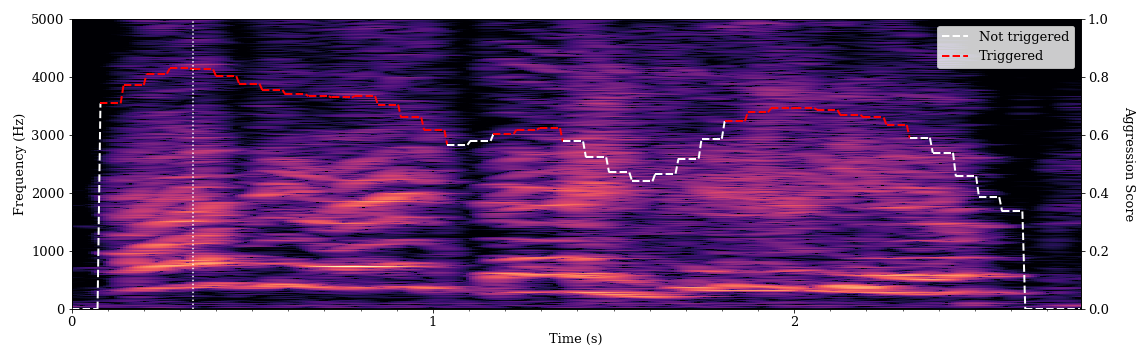
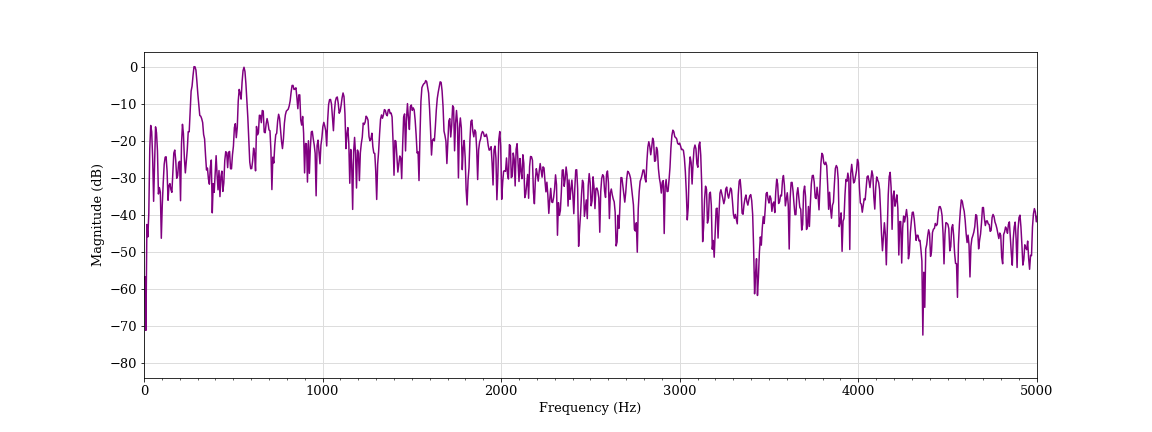
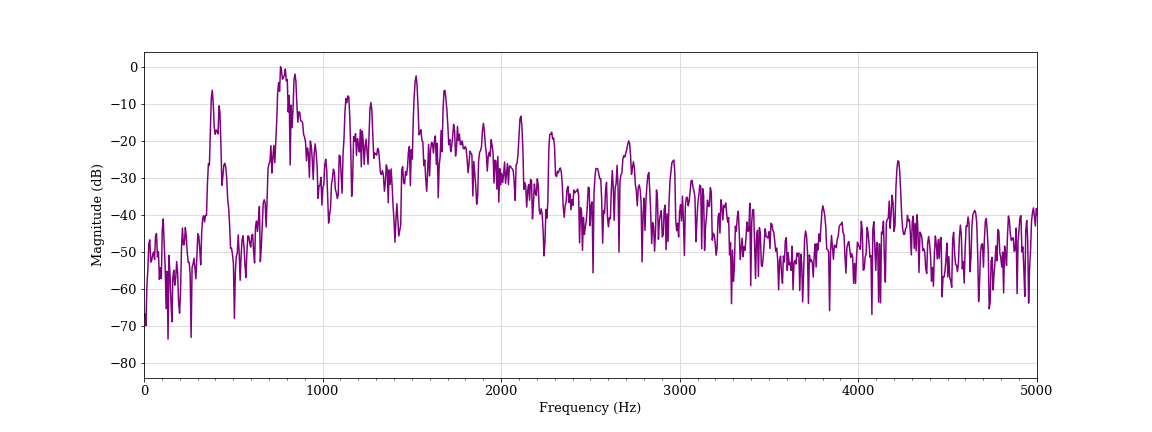
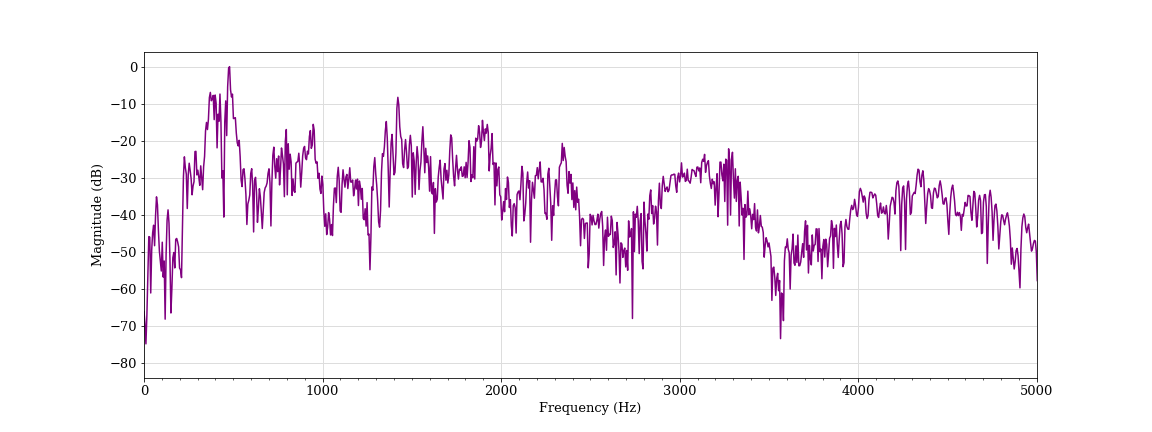
Below is a spectrogram of speech for two students as they introduce themselves: student A at 0.1 seconds and student B at 1.1 seconds. These are examples of normal speech having a relatively clear tone and little auditory distortion. The algorithm gave this speech a low aggression score, and it did not trigger an alarm.
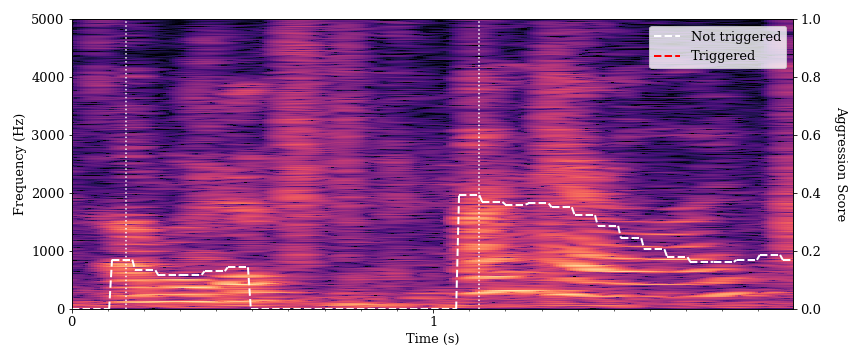
There are bright and distinct striations visible in the lower frequency portion (bottom) of the spectrogram. These represent the loudest frequency components of the students’ speech. The bottommost (lowest frequency) band for each speaker is the fundamental frequency, or the perceived pitch of a voice. Successive bright bands at regular intervals above the fundamental represent the harmonics of the speech. Wider intervals between those bands indicate a higher pitch, and we can see that student B’s voice is higher-pitched. The more distinct these bands, the clearer the speech will sound (although many factors affect speech clarity). There is also a fairly clear drop-off in brightness (sound intensity) in the higher frequency components of the spectrogram for both utterances. This characteristic is representative of speech sounds.
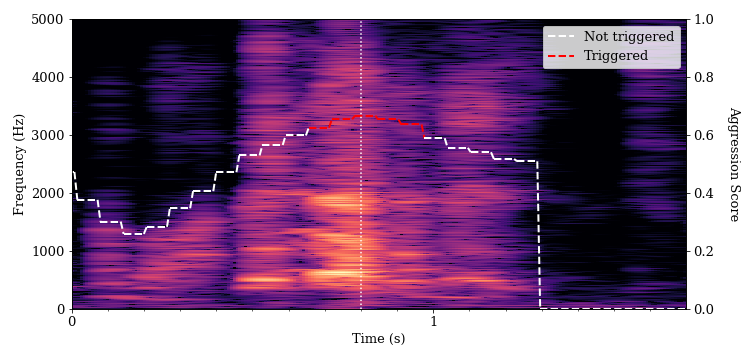
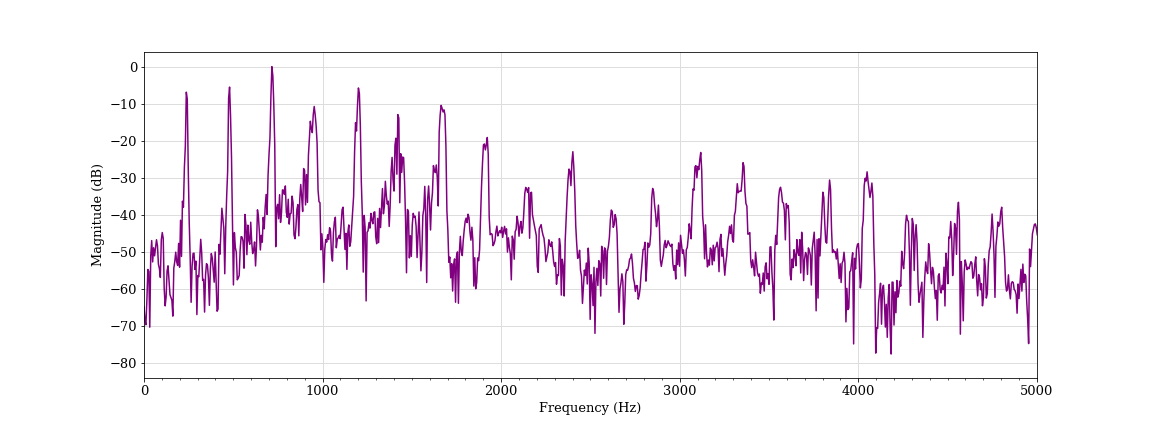
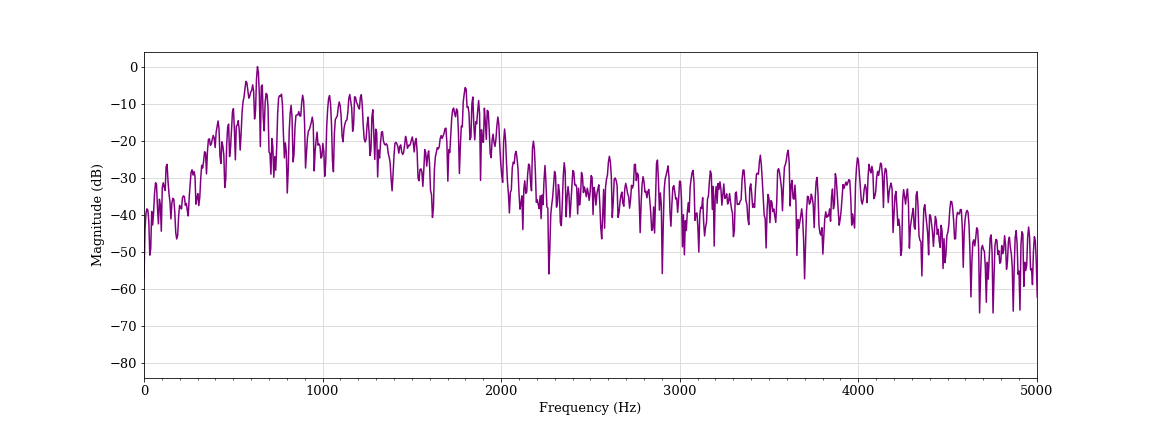
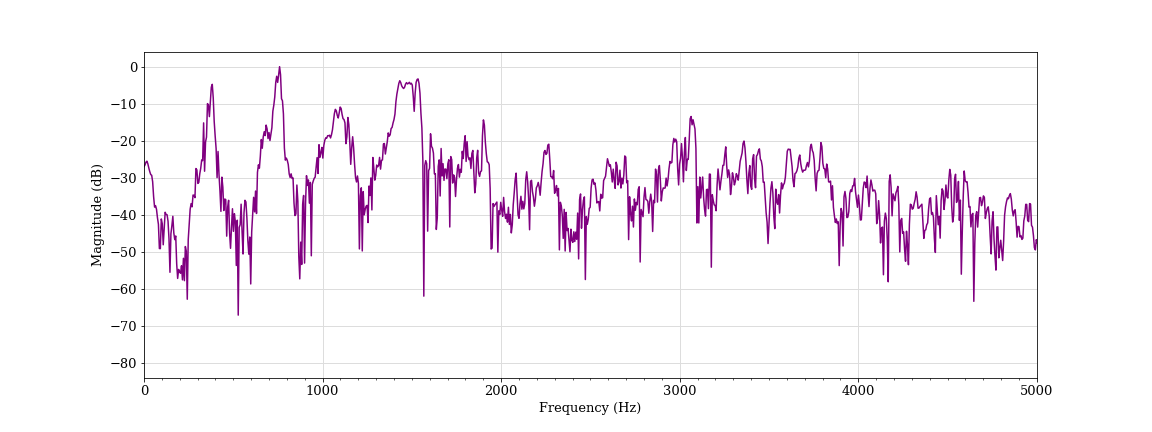
This is a spectrogram of a simulated shout from student A.
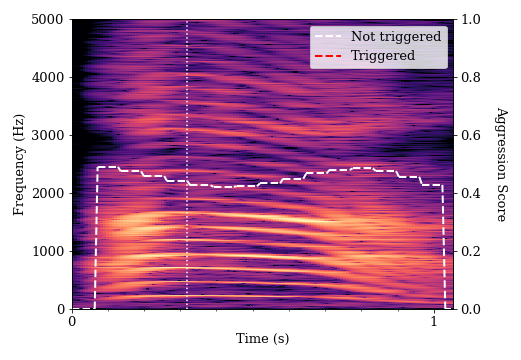
The harmonic bands have greater separation here, which indicates a higher pitch for student A than his previous utterance. We see a higher number of bands in the harmonic frequencies, which is perceived as a more intense sound. There are also brighter bands in the upper part of the spectrogram, which shows more balance between lower and higher frequency components. This balance is known as a flatter spectral tilt — a quality often associated with stressed voices. However, the bands of sound remain distinct and well-defined, which indicates that the speech has a clear tone without much distortion. While this sound clip had a higher aggression measurement, it was ultimately classified as non-aggressive by the algorithm. Human annotators also did not find this simulated shout convincingly aggressive.
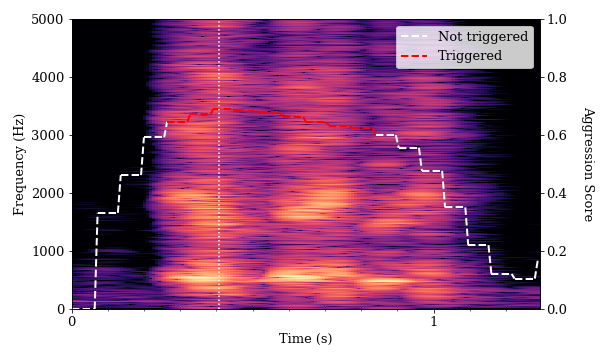
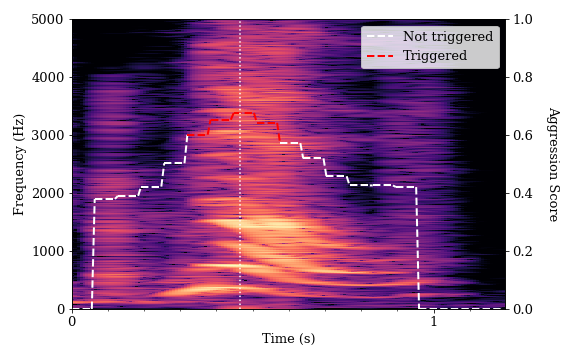
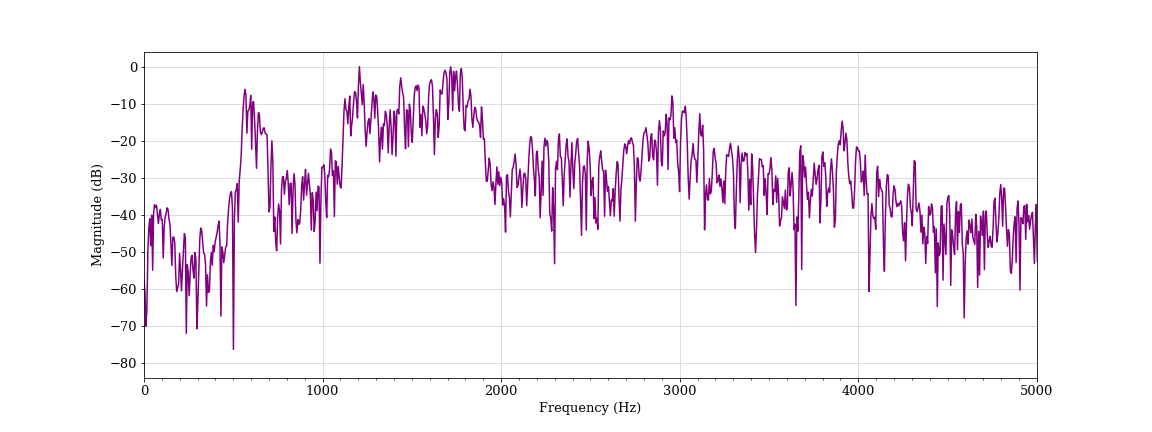
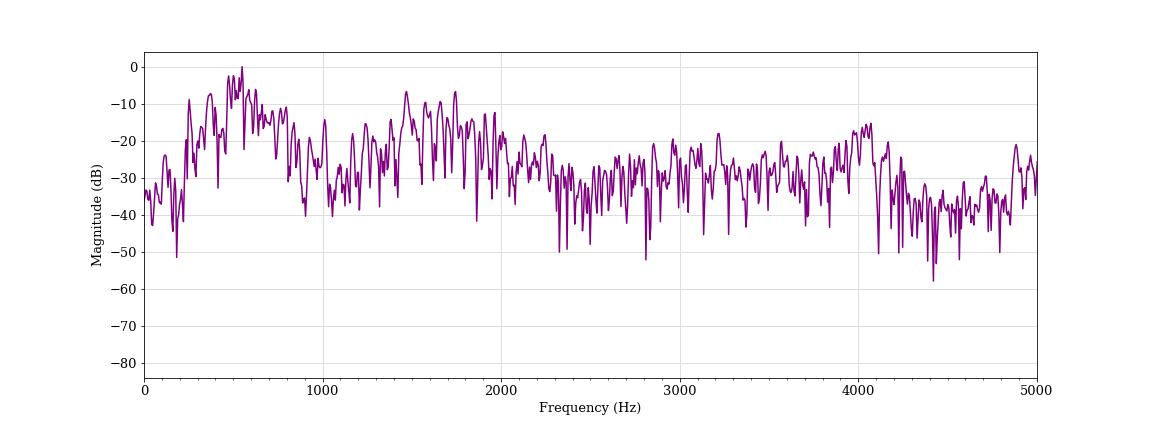
This is a sound frame of a simulated scream from student A.
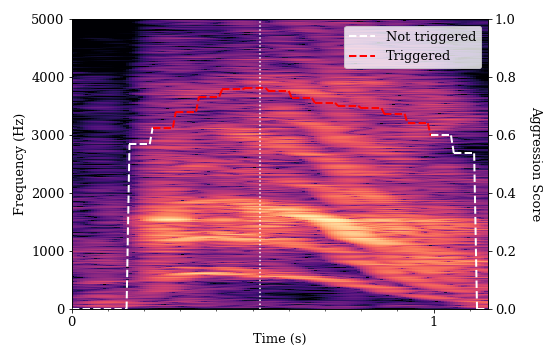
This sound has high intensity in the higher frequency components and displays far less distinct bands compared with the previous examples. This indicates some vocal strain in the speaker. The fundamental frequency and harmonics are far less well defined, which indicates audio distortion and a much rougher tone to the sound. This characteristic is also referred to as spectrum whitening. 14 We found that audio frames with higher-pitched vocalizations (higher fundamental frequency), higher frequency components (flatter spectral tilt), and that contain distortions (spectral whitening) tended to trigger the algorithm. Human annotators found this simulated scream convincingly aggressive and the algorithm agreed.
Analyzing Errors
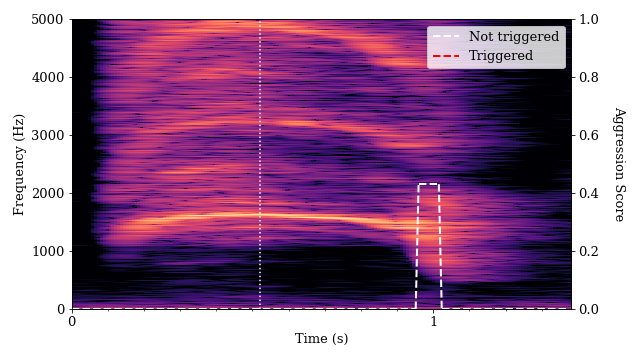
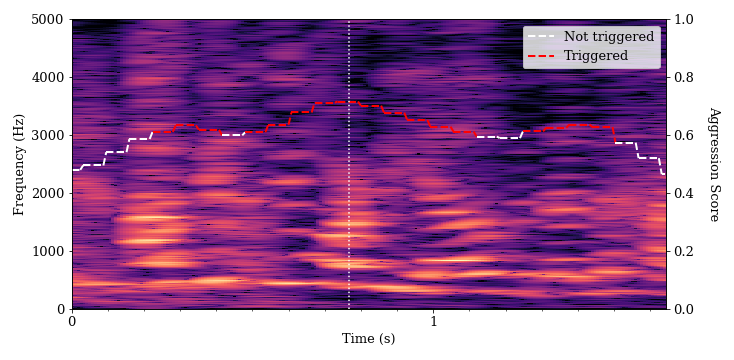
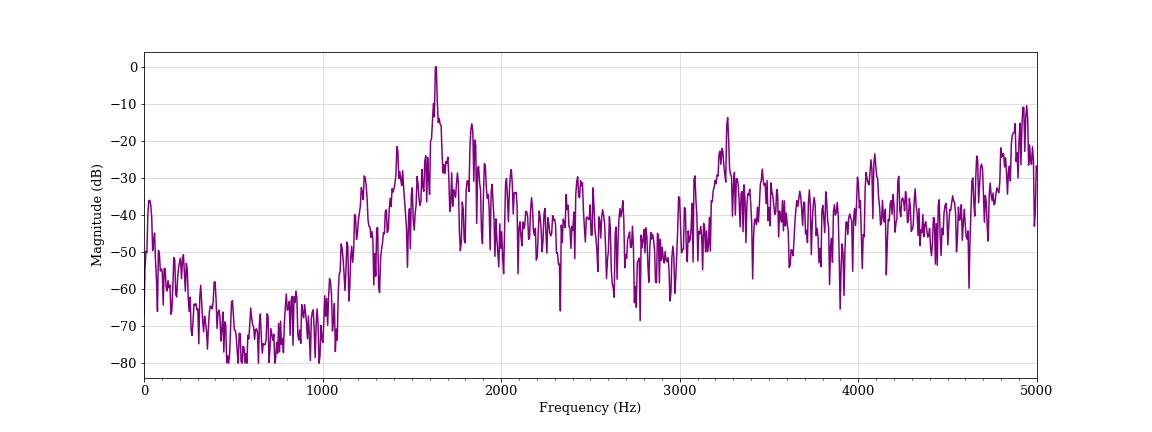
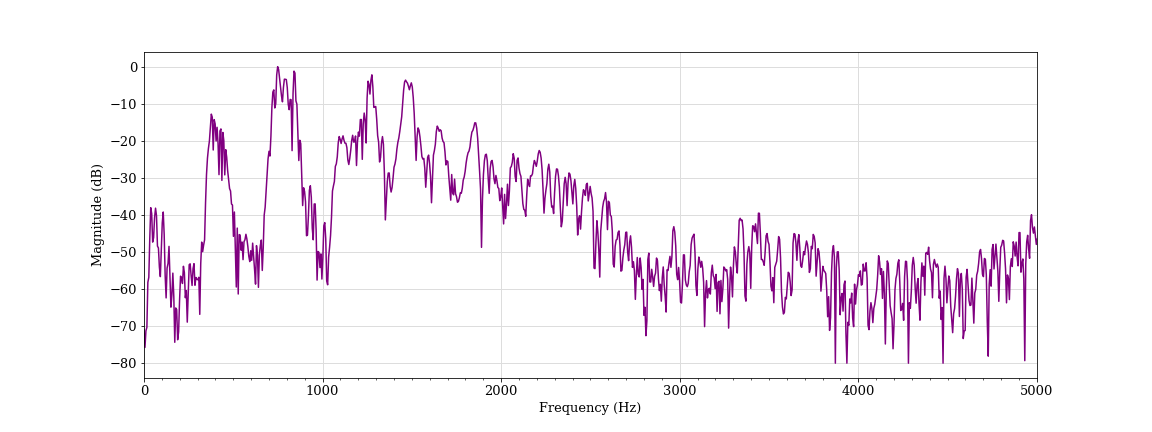
At the same time, we identified instances where high-pitched shrieks did not trigger the algorithm. The scream below is very high-pitched, has high-frequency components and contains the spectrum whitening that indicates vocal strain. However, the algorithm did not provide an aggression measurement above zero for most of the duration of the sound. While this was one of the sounds that had one of the highest measures of pitch and distortion, it did not contain a pattern that the algorithm recognized as an aggressive voice.
Machine learning models such as the aggression detection algorithm depend on pattern matching to the labeled data it is fed in training. If the training data used did not include examples of shrieks, or if the labeling process failed to identify such noises as aggressive, the algorithm may not correctly characterize such sounds in operation.
When asked about the false negatives from higher-pitched shrieks, Sound Intelligence responded that they may result from the device not processing higher frequency components of audio. They also cited the potential similarity of shrieks to baby cries in their training data, which they labeled as non-aggressive.
We also found a number of instances where the algorithm determined that singing, laughing and coughing were aggressive. We provide some examples of such vocalizations below. In each of these spectrograms, there is some evidence of flatter spectral tilt and spectral whitening, particularly when compared to normal speech.
We also found a number of instances where activated, energetic speech (known in psychology as high-arousal speech) triggered the algorithm. Women’s voices tend to be twice as high as men’s. We found that every speaking voice in the pair testing that triggered the algorithm belonged to a female student.
It would require a large number of individuals from a full demographic range to fully train or test the device for effectiveness in all of its potential applications. At the same time, pitch and tonal quality vary among individual voices, even for people in the same demographic. Since the device is often installed in schools, we tested it on student populations. However, a more comprehensive dataset with a wider variety of voices would improve the analysis and give a fuller understanding of the contours and universal applicability of the underlying algorithm.
Calculating Features
Instead of examining the spectrum for the audio clips frame by frame, the Sound Intelligence algorithm calculates a set of features from the spectrum and uses them to discriminate between aggressive and non-aggressive audio. In our analysis, we similarly calculate features from sound frames that broadly represent some spectral characteristics.
These features are statistical summaries of the characteristics of a spectrum that can allow us to differentiate between different sound frames. They were taken from a review of academic research (including by Sound Intelligence) about audio features commonly used in the field of voice affect recognition and by the features’ predictive value to the algorithm output. However, these are not the exact features used by the Sound Intelligence algorithm. We instead chose features that would broadly reflect the pitch and tone characteristics of a sound. We previously noted instances where higher pitched vocalizations having a rougher tone and vocal strain tended to trigger the algorithm. We calculate features that correspond to those qualities:
Features Relating to Pitch
- Fundamental Frequency: the peak with the lowest frequency in the sound spectrum, which is perceived as pitch by the human ear. 15
- Peak Frequency: the frequency in the spectrum with the highest intensity.
-
Spectral Centroid: the average of a spectrum’s frequency components, weighted by intensity.
16
Features Relating to Sound Quality
- Spectral Rolloff: the frequency cutoff below which most of the energy of a sound is contained. A higher spectral rolloff indicates that there is more energy in the higher-frequency components of a sound. 17
- Spectral Flatness: a measure from 0.0 to 1.0 for how similar a spectrum is to white noise, which has a spectral flatness of 1.0. 18
We aggregated the pair and group testing data and took a sample of the sound frame features that did or did not trigger the detector. 19 We then analyzed this data to learn which audio features the Sound Intelligence algorithm may be correlating with aggression.
The distribution of the five features discussed is shown on the below plot along the diagonals. The orange curve represents features for sounds the algorithm found to be aggressive, and the blue curve represents non-aggressive sounds. As vocalizations became higher pitched, contained more energy in the higher frequency components and were accompanied by higher metrics for the “whitening” of the sound spectrum, the algorithm generally tended to predict aggression.
Plotting Pairs of Sound Features
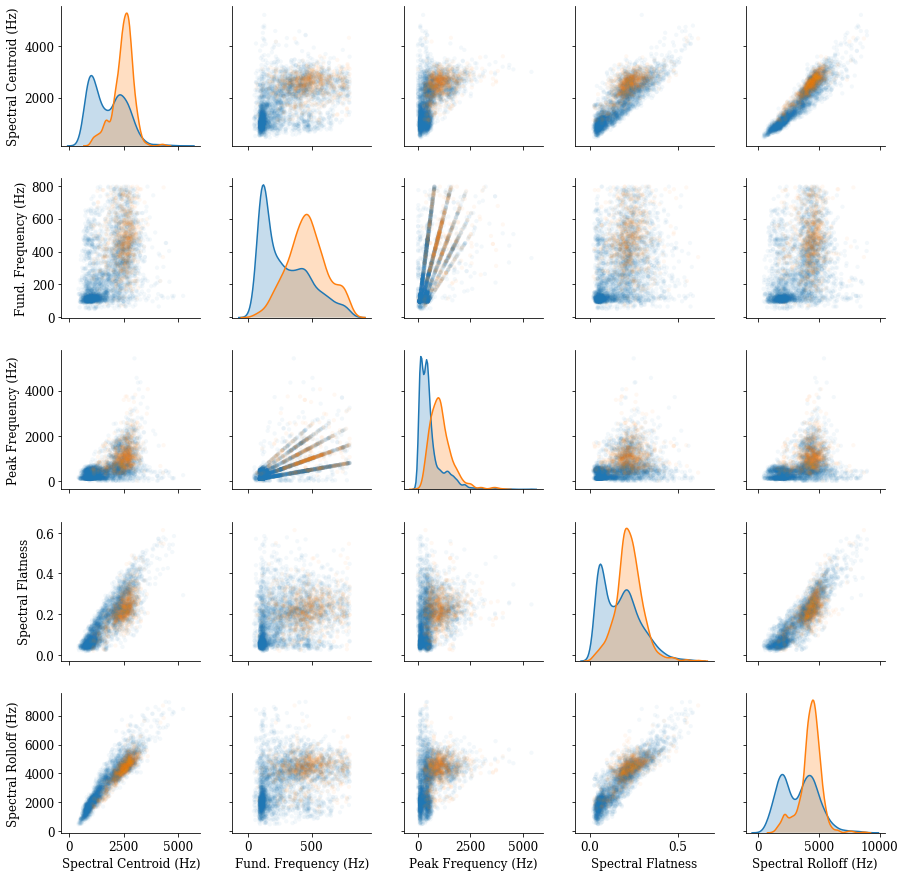
By looking at pairs of features together above, we can see even better separation between the data points the algorithm found as aggressive (orange points) or not (blue points). We can thus visually separate the features for sound frames found to be aggressive and non-aggressive by the algorithm and identify ranges and combinations of sound features that correlate with an inference of aggression. 20 Sounds outside of those ranges, whether higher or lower, did not contain features that the algorithm is trained to detect as aggression.
Discussion
Given that the algorithm operates off of audio features and does not take context or meaning into account, the apparent errors we found are foreseeable. Sound Intelligence acknowledges that the detector is imperfect, but maintains that the device is a valuable early warning system, particularly when calibrated properly and tested in real-world situations. While we have examined the performance of the algorithm, we should note that this is not a study of the real-life operation of the device. This testing also does not seek to measure whether this system is more effective than what we see as the baseline: the perception, communication and judgment of students, teachers and school administrators.
Academics and lawmakers have raised questions about using big data and algorithms as a substitute for human judgment. For example, what kinds of disparate impacts can be inadvertently created by an algorithm? 21 When an algorithm assigns blame for reasons that are difficult to comprehend, how does the broader system prevent punishing innocent behavior? 22 How much transparency should be provided to the surveilled about the training data and design of such algorithms? 23 We hope that this study prompts further discussion and research into audio analytics devices sold to the public, and algorithmic decision making in general.
Acknowledgements
We would like to thank the following people for the time and expertise they shared in reviewing our work. Their review does not constitute an endorsement of our methods or our discussion, and any errors are our own.
Dr. Heather Lynch, associate professor in the Department of Ecology and Evolution at Stony Brook University and ProPublica data science adviser.
Dr. Michael Mandel, associate professor of computer and information science at Brooklyn College.
Dr. Maureen Lynch, fellow, Environmental Data Initiative.
Dr. Shae Morgan, assistant professor of audiology at the University of Louisville School of Medicine, separately reviewed some of the audio data used in this methodology.
ProPublica data reporter Sophie Chou reviewed the code and analysis.
Appendix A
Normal speech, male student A (classified as non-aggressive)
Normal speech, female student B (classified as non-aggressive)
Simulated shout, male student A (classified as non-aggressive)
Simulated scream, male student A (classified as aggressive)
Simulated scream, female student C (classified as non-aggressive)
Singing, female students D and E (classified as aggressive)
Laughing, female student D (classified as aggressive)
Coughing, female student F (classified as aggressive)
Activated speech, female student D (classified as aggressive)
Activated speech, female student F (classified as aggressive)
Activated speech, female student B (classified as aggressive)
-
Sound Intelligence engineers said the latest version was calibrated using audio collected in part from European customers, including some recordings of screaming children. We did not receive a direct response when we asked if any of the training data came from schools. ↩
-
The device can be fine-tuned by adjusting three variables: (i) the general sensitivity of the device (which has five settings), (ii) the volume over background noise at which sound is detected and (iii) the minimum time required to trigger a finding of aggression. For our testing, we followed Sound Intelligence’s recommendation to test the device at medium sensitivity, 10dB, and 500ms. However, the original recommended settings were 5dB and 500ms, according to our correspondence with Louroe and a guidance document it provided. ↩
-
The measurement of aggression tended to lag the timing of the sound by a fraction of a second. In order to match the timing of the aggression measurement with the timing of the sound itself, we wrote a script to simultaneously play and record the sound and sync the aggression detector data with the audio data. ↩
-
Lynch is an associate professor in the Department of Ecology and Evolution at Stony Brook University. Her research includes the analysis and characterization of penguin bioacoustics. ↩
-
The sound clips were recorded and played back at a 48,000 Hz sampling rate, which was far higher than the sound frequency components processed by the Sound Intelligence algorithm. ↩
-
A prediction of non-aggression is the default state for the device. We did not count the number of true negatives (occasions where the device correctly was not triggered), since in a continuous recording with cross-talk it is impossible to determine when one vocal event ends and another begins. ↩
-
We counted a continuous triggering of the device as a false positive. Vocalization category is based on one annotator’s judgment of the most prominent sound at that time. We also note that the number of false positives exceeds the number of notifications that would be sent from the device in actual operation. This is because the device only sends one notification if multiple alarms are encountered in a short period of time. ↩
-
There were three instances where applause or singing triggered the detector in the group setting. ↩
-
A vocalization was considered to trigger the detector if we measured at least one alarm during it. In contrast to the group experiments, we also counted the number of vocalizations where the device was not triggered in the pair testing, since specific triggering and non-triggering vocal events could be isolated and identified. ↩
-
Human annotators determined from direct observation whether a sound clip was genuinely aggressive. Two annotators listened to a sound and classified it as aggressive if they agreed that a reasonable school administrator hearing it would be concerned and investigate. Disagreements between the first two annotators was resolved by a third annotator’s review. ↩
-
We did not tabulate speech as most of the recordings contained speech that did not trigger the device. ↩
-
For a more complete description of the fourier transform and its use in signal analysis, please see the textbook “Signals and Systems” by Alan V. Oppenheim and Alan S. Willsky, with S. Hamid Nawab. ↩
-
We also include the spectrum of select frames marked by the vertical white dotted line for review in Appendix A . ↩
-
Spectrum whitening refers to where the spectrum of the sound begins to appear more like white noise, which has an equal intensity at every frequency. ↩
-
This is calculated using the fundamental frequency finding algorithm described in Sound Intelligence’s 2007 paper, “ Verbal aggression detection in complex social environments ” by P.W.J. van Hengel and T.C. Andringa. ↩
-
This is calculated using the librosa sound analysis library . ↩
-
We used 85% of energy for the spectral rolloff calculation. This is calculated using the librosa sound analysis library. ↩
-
This is calculated using the librosa sound analysis library. ↩
-
Out of the more than 500,000 sound frames available from our testing, we took a random sample of 2,000 out of more than 100,000 aggressive sound frames having a greater than 0.5 aggression score to represent sound frames that would trigger the detector, and 2,000 non-aggressive sound frames from the opposite side of the distribution to represent sound frames that would not. For this analysis, we considered only audio frames having an aggression score greater than zero and a volume reading greater than the 50th percentile, since not all sound feature calculations are meaningful; for example, for background noise and silence. ↩
-
As we note above, these are not necessarily the features used by Sound Intelligence. They have also noted that they calculate more features than the ones we measure here. ↩
-
“ Big Data's Disparate Impact ” by Solon Barocas and Andrew Selbst. ↩
-
“ Yes, Government Should Regulate Automated Decision-Making ” by Cathy O’Neil and “ Secret Algorithms Threaten the Rule of Law ” by Frank Pasquale. ↩
-
Examples of laws to make algorithmic decision-making more transparent include Local Law 49 in New York City and Article 22 of the GDPR. ↩