For our analysis of birth complications, we acquired all inpatient discharge records of hospital stays for a two-year period (2014 and 2015) across three states: New York, Florida and Illinois. We received these datasets from state health agencies, which collect hospital data at the patient level, including information on a patient’s diagnoses, characteristics, procedures and services. While there are some small differences in how each state reports data, many researchers use this data to study health care system inequities, like racial or socioeconomic gaps.
To explore the racial disparities in birth complications, we focused on one of the most common and preventable causes of maternal mortality and morbidity: hemorrhage, or excessive bleeding. We chose hemorrhage because unlike other causes of maternal harm, such as hypertensive and blood clot disorders, hemorrhage is less strongly associated with race or socioeconomics compared to other factors. Because of this weaker association and its relative high frequency across hospitals, we used post-hemorrhage outcomes as a proxy variable for understanding larger trends of morbidity and mortality. Across our dataset of three states, we analyzed over 1 million births and more than 67,000 hemorrhage events.
Read the Story
Read More

Employing a methodology that has been used by prominent researchers, including members of the California Maternal Quality Care Collaborative, we started by finding the number of women at each hospital who hemorrhaged during birth and then found how many of those women had major complications after or along with that hemorrhage, including needing a blood transfusion or hysterectomy. Based on previous research conducted by the CMQCC, we postulated that the lower the number of cases that include these major complications, the better that hospital is at managing these hemorrhages.
Research has shown that when hospitals decrease their rate of complications after or along with hemorrhages, the overall maternal morbidity rate declines. The findings suggest that targeted improvements of obstetric protocols related to one preventable birth complication may have a positive effect on a hospital’s ability to respond to birth complications generally.
“It creates improvement in the team, increases communication and improves your response to all emergencies, not just hemorrhage,” said Dr. Elliott Main, the director of CMQCC. Ultimately, a hospital that is better at managing hemorrhage may also be better at managing other morbidity events.
Identifying Births
To identify all births and morbidity events, including hemorrhage, ProPublica used a coding algorithm developed by the Alliance for Innovation on Maternal Health, also known as AIM, a national maternal safety and quality improvement initiative that uses data to improve maternal birth outcomes. We identified all births using delivery diagnosis, procedure or diagnosis-related group codes. As prescribed by the AIM algorithm, we excluded cases of ectopic or molar pregnancy, or any other pregnancy with an abortive outcome.
Identifying Hemorrhages
AIM’s algorithm relies on indicators of severe maternal morbidity that have been developed by the Centers for Disease Control and Prevention. The CDC has identified associated International Classification of Diseases, also known as ICD, codes to help hospitals and researchers better identify maternal morbidity events. We looked at events that were marked with ICD codes for procedures and diagnoses, as well as the diagnosis-related group classification system. Within the time period that includes our data, the ICD codes shifted from ICD-9 to ICD-10. Fortunately, the coding tool from AIM included a crosswalk that enabled us to include both iterations of payment coding. All of the codes used in this analysis can be found here. To flag all hemorrhage cases, we relied on AIM’s algorithm, which identified specific ICD and diagnosis-related groups for previa, abruption, antepartum and postpartum hemorrhage diagnoses, and blood transfusions. We excluded patients who hemorrhaged that concurrently had a sickle cell diagnosis.
Identifying Severe Maternal Morbidity Indicators
Relying on AIM’s algorithm of indicators of severe maternal morbidity, we identified all cases of acute myocardial infarction, acute renal failure, adult respiratory distress failure, amniotic fluid embolism, aneurysm, cardiac arrest or ventricular fibrillation, disseminated intravascular coagulation, eclampsia, heart failure during a surgery or procedure, puerperal cerebrovascular disorders, pulmonary edema, severe anesthesia complications, sepsis, shock, thrombotic embolism, blood transfusion, conversion of cardiac rhythm, hysterectomy, temporary tracheostomy, and ventilation using procedure, diagnosis and diagnosis-related groups.
Calculating the Hemorrhage Complication Metric
To calculate a “hemorrhage complication rate” for each hospital, we divided the number of hemorrhages that occurred after or along with other noted morbidity events by the total number of hemorrhages at each hospital.
While we did not control for factors at each hospital like average level of prenatal care or the socioeconomic level of the patient, we did look at comorbidities of patients, isolating the patients that were “healthier” from those that arrived at the hospital with additional chronic health factors. We defined our healthy pool by looking at mothers who were of average age at delivery (between 25 and 31 for Illinois and Florida and between 26 and 32 for New York) and did not, according to the data, have diabetes, heart disease or hypertensive disorders.
To identify comorbidities, we relied on the Elixhauser Comorbidity Index, which is a method of identifying comorbidities using ICD codes. There are about 30 categories in the Elixhauser Index. Each category is dichotomous, meaning that a patient either has a comorbidity, like diabetes, or the patient does not. The mapping algorithm that we are using for the Elixhauser categories comes from the Agency for Healthcare Research and Quality, a federal medical research agency. For our analysis, we also looked at two different hospital cohorts: hospitals with more than 50 births and those with more than 500 births across two years.
Our data analysis focused on hospitals that serve a disproportionate number of black patients compared to other hospitals within each state. We then compared these hospitals to those that serve fewer black patients. To do this, we split hospitals into three groups (high black-serving, medium black-serving and low black-serving). In order to prevent any one hospital from over-representing the pool, we limited the number of categories to three. We then compared trends in each group to determine whether hospitals that serve more black patients had higher or lower rates of birth complications on average.
For Illinois and Florida, we clustered the hospitals using Jenks natural breaks optimization with three classification groups. For New York, we grouped the hospitals with the same clustering technique, but with five classification groups (the two highest groups representing “high”), in order to achieve a similar cluster size as the two other states. The number of hospitals in each group and the thresholds for low, medium and high groups varied by state.
| State | Low black serving | Medium black serving | High black serving |
|---|---|---|---|
| FL | 60 | 42 | 11 |
| IL | 70 | 34 | 12 |
| NY | 58 | 52 | 15 |
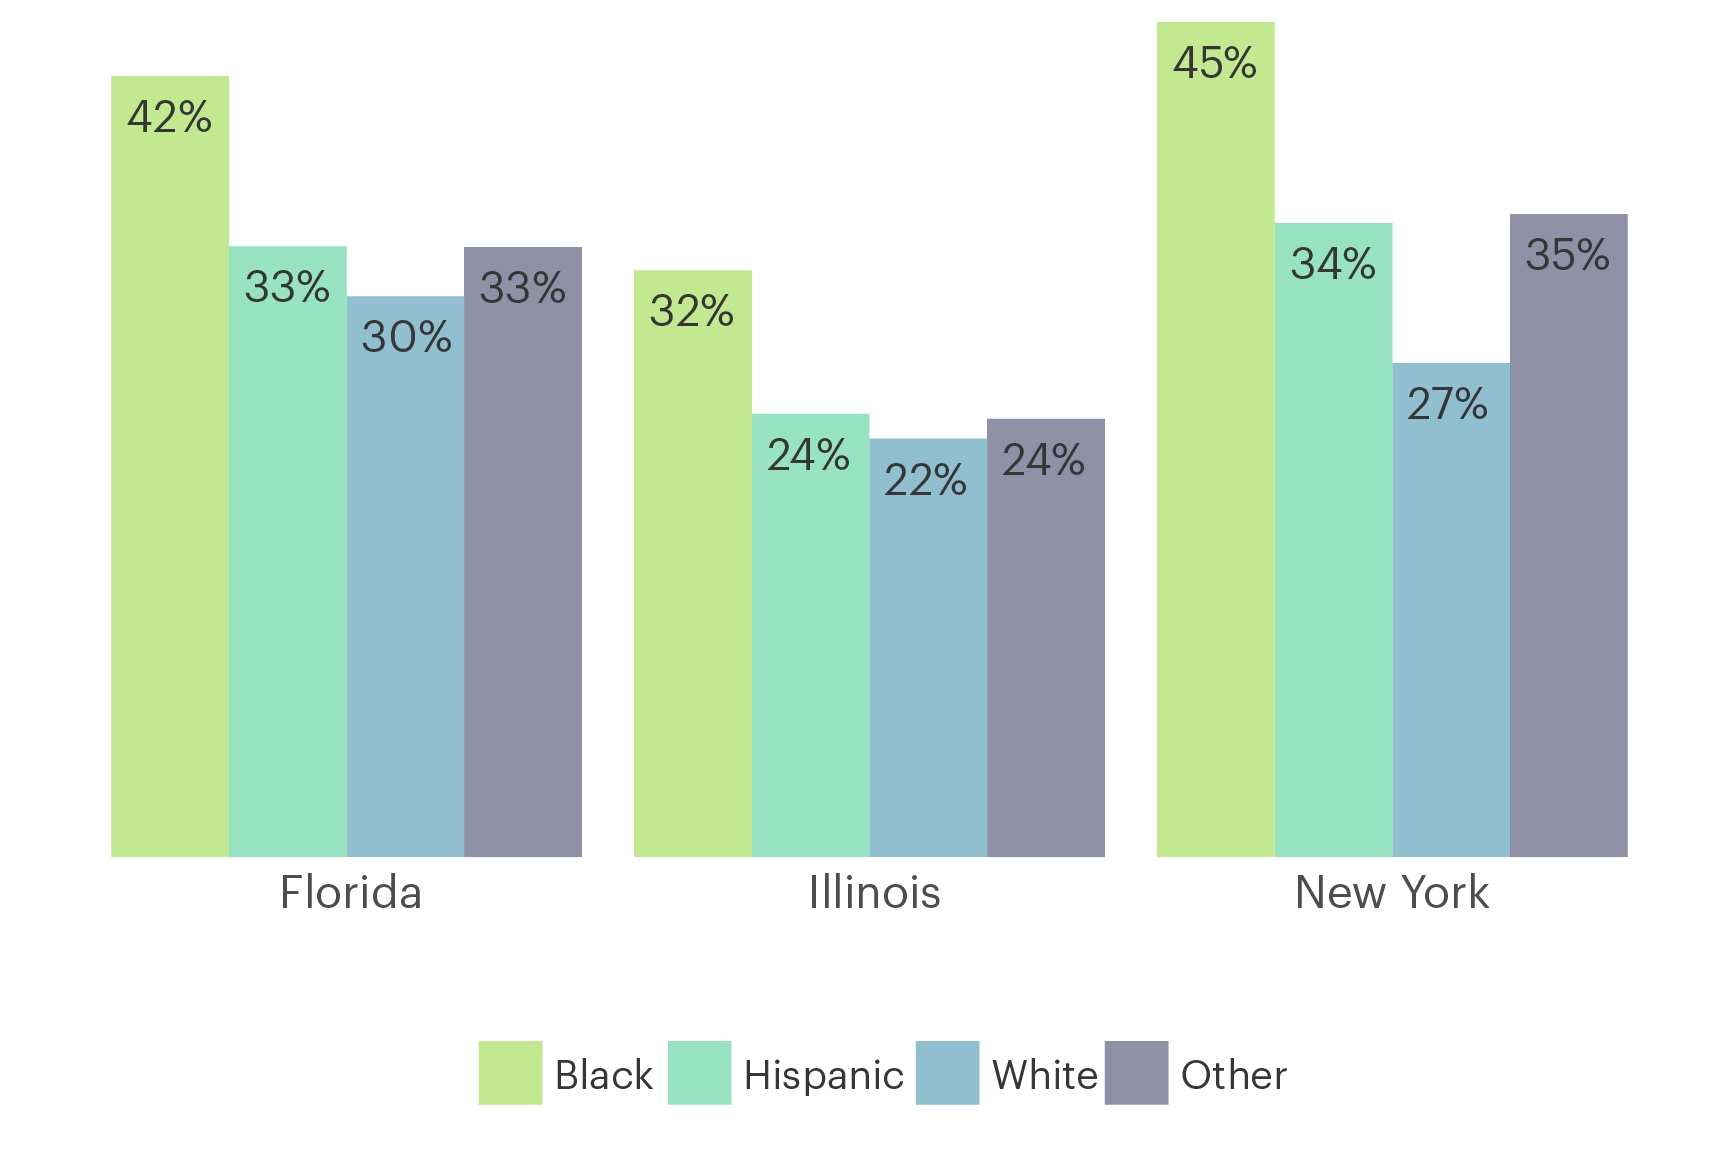
Across all three states that we looked at, we found a clear racial gap in hemorrhage complication rates. While black mothers appear to hemorrhage at about the same rate as mothers of other races, on average, they have much higher rates of complications related to hemorrhage.
Black Women Who Hemorrhage During Childbirth Have Higher Rates of Complication, Regardless of the Hospital They Visit
Maternal complication rate by race, 2014-2015
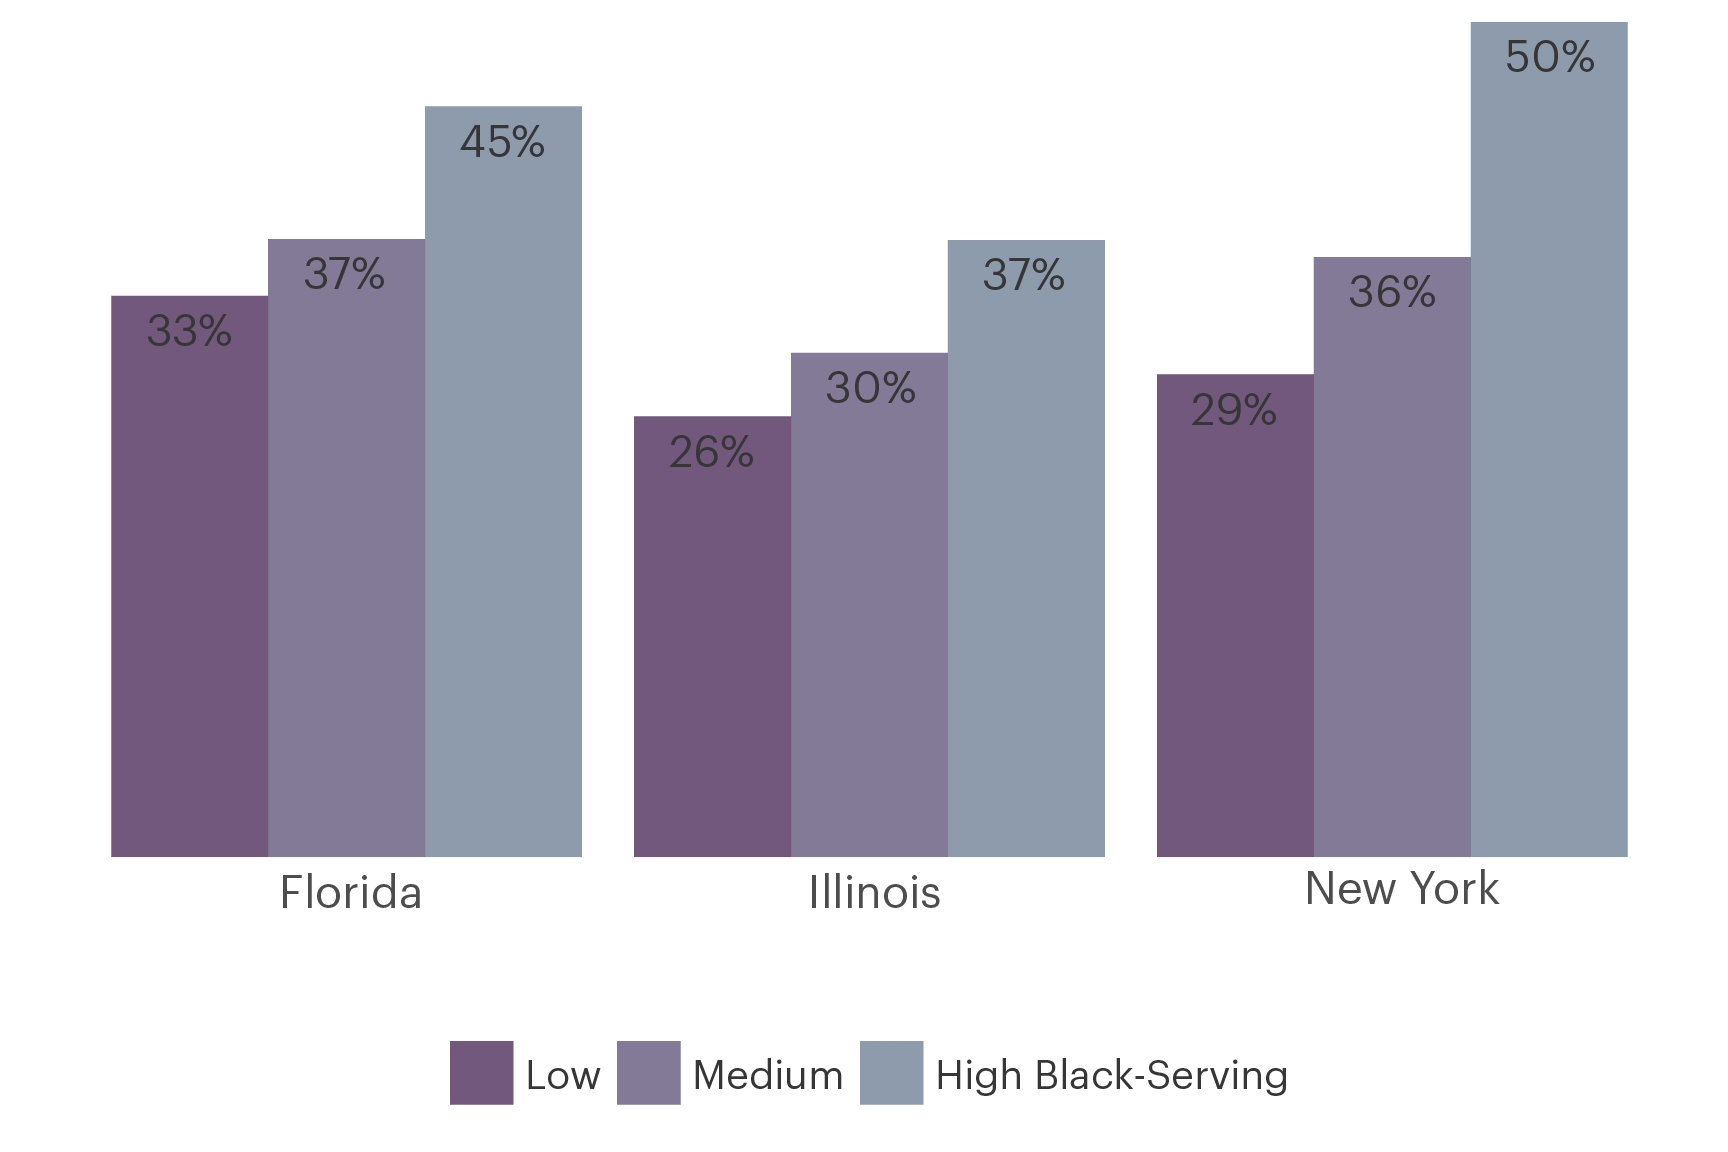
At disproportionately black-serving hospitals in all three states, the average number of maternal hemorrhages that occurred alongside a severe maternal morbidity event was significantly higher than at hospitals that serve disproportionately fewer black patients.
Black-Serving Hospitals Have a Higher Rate of Maternal Complications for All Patients Who Hemorrhage, Regardless of Race
Complication rates for hospitals grouped by prevalence of black maternity patients, 2014-2015
This trend was consistent even when looking at only healthy patients, specifically patients who did not have heart disease, like congestive heart failure of valvular disease, hypertension or diabetes. The pattern was also consistent for patients at large hospitals (those with over 500 births over two years).
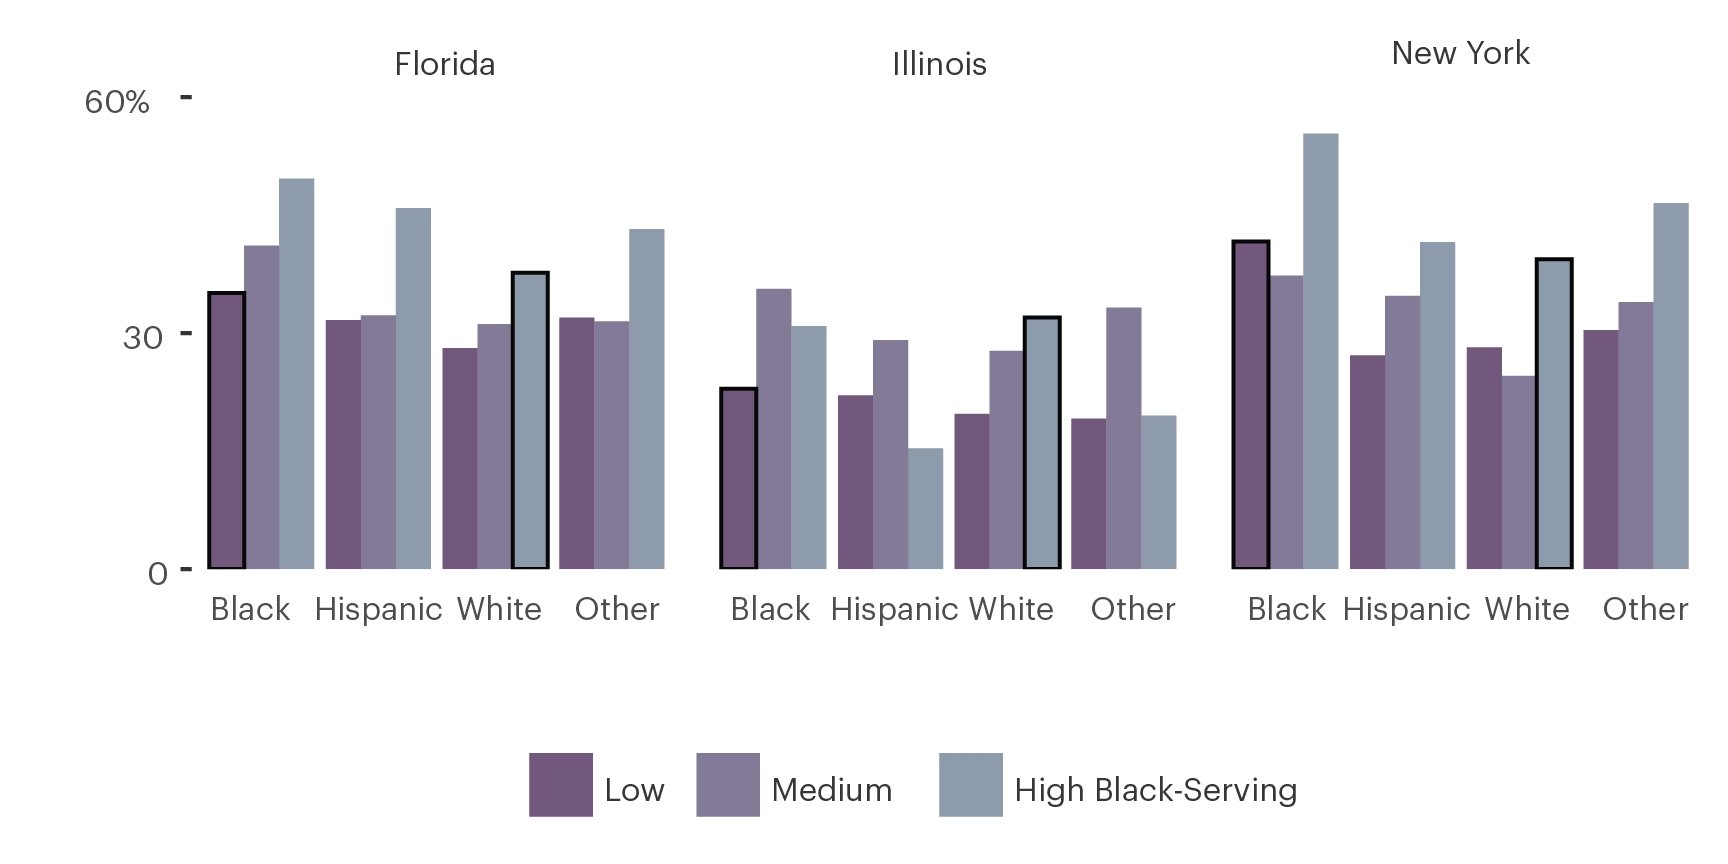
We also looked at the gap in the quality of care between white mothers at hospitals that disproportionately serve black patients and those that don’t. White mothers have worse post-hemorrhage outcomes at hospitals that disproportionately serve black patients than those that don’t. This suggests that one can’t attribute the difference in hospital outcomes to inherent differences in the groups of patients they serve. Because the hospitals that have the worst outcomes on average primarily serve black patients, there is a disproportionate impact on patients who receive care at institutions that primarily serve black patients. This finding suggests that the quality of care at a hospital may factor into a woman’s risk of birth complications.
White Women Who Hemorrhage When Giving Birth at High Black-Serving Hospitals Have About the Same or Higher Rate of Complications as Black Women Giving Birth at Low Black-Serving Hospitals
Complication rates grouped by state, patient race, and hospitals’ prevalence of black maternity patients, 2014-2015
This analysis has some limitations. It relied on inpatient hospital discharge data, which is self-reported by hospitals. The data is submitted for billing purposes and is supposed to be accurate, but we cannot account for errors or inaccuracies in what hospitals submit.
Because of the way that the data is coded, we do not know whether hemorrhages occurred before, after or at the same time as the other severe maternal morbidity events, therefore it’s difficult to determine whether the relationship between hemorrhage and any other severe maternal morbidity events is causal. That being said, Dr. Main, who has employed the AIM methodology for his own studies, told ProPublica that hemorrhage is likely the cause of at least 90 percent of the complications included in this kind of an analysis and it’s probable that only 10 percent of these events are incidental.
Additionally, our analysis does not take into account severity of hemorrhage or other birth complications. One of the most common indicators of birth complications in our analysis was the presence of a blood transfusion. Some hemorrhage events require multiple transfusions of blood, while other events may only require one. The administrative payment datasets that we are using only take into account whether the hemorrhage was severe enough to warrant a transfusion. We don’t have access to individual patient clinical records and therefore don’t have a complete picture of a patient’s health history which could include factors that contribute to birth complications.
We believe this metric is a reasonable proxy for overall care at the hospital and we hope that researchers with greater access to clinical datasets will examine this further.
For our analysis, we received data from New York’s Statewide Planning and Research Cooperative System, also known as SPARCS and the Illinois Department of Public Health, Office of Policy, Planning and Statistics. We also received a limited dataset from the Florida Agency for Health Care Administration. The Florida Agency for Health Care Administration specifically disclaims responsibility for any analysis, interpretations, or conclusions that may be created as a result of its limited data set.