Over the past year, ProPublica has been tracking civil rights issues in schools across the country. We’ve reported on Obama-era investigations that have been closed by the Trump administration. We released a database of every civil rights investigation carried out by the U.S. Department of Education’s Office for Civil Rights over the past three years. And this month, we published Miseducation, a news application that allows you to look up racial disparities in more than 96,000 schools and 17,000 districts using data from the 2015-16 school year.
Read More

Using our database, we’ve written about how the long history of segregation and resistance to integration in Charlottesville, Virginia, has contributed to one of the widest achievement gaps between black and white students in the country.
Local reporters have also used our database to dig into racial disparities in schools and districts. Chalkbeat reporters examined student access to behavioral and social support staff in New York City, lapses of school discipline in Newark, New Jersey, and the dearth of Advanced Placement courses in Detroit’s high schools. Bethesda Magazine used our news application to look at the achievement gap in Montgomery County, Maryland, and Indy Week reported on racial disparities in school punishment in Wake and Durham counties in North Carolina.
So how can you investigate civil rights issues in your school district?
Key Definitions
Before you dive into your investigation, you should understand some key concepts.
Advanced Placement courses are upper-level classes that high school students can take to obtain college credit.
Gifted and talented programs provide specialized support and enrichment activities to students that a school district identifies as exceptional.
Out-of-school suspensions are a form of school discipline in which children are temporarily removed from school for bad behavior. The punishment differs from an in-school suspension, in which a student is temporarily removed from his or her classroom but remains under the supervision of school personnel.
A dissimilarity index is one of the most commonly used measures of segregation. In our online database, we calculate how evenly distributed two racial or ethnic groups of students are across schools in a district.
The achievement gap refers to a persistent gap in academic performance between certain racial and ethnic groups of students.
A risk ratio is a measurement that compares the risk of an event between two groups. In our news application, we have calculated risk ratios to illustrate racial gaps in how often students are suspended or participate in high level academic programs.
Title VI is a part of the Civil Rights Act of 1964 that prohibits discrimination based on race, color or national origin in programs that receive federal funds, including the nation’s 96,000 public schools.
Title IX is part of the Education Amendments of 1972 that prohibits discrimination on the basis of sex in education programs or activities that receive federal funds.
ADA/504 refers to the Americans with Disabilities Act and Section 504 of the Rehabilitation Act, both of which prohibit discrimination against students on the basis of disability.
Story Ideas
There are dozens of stories you can report out in any school or district. Here are a few ideas to help you launch an investigation into local education inequities.
1. White students nationally are more likely than other groups to participate in gifted programs and Advanced Placement classes, which contributes to the achievement gap. Does this reflect your local schools
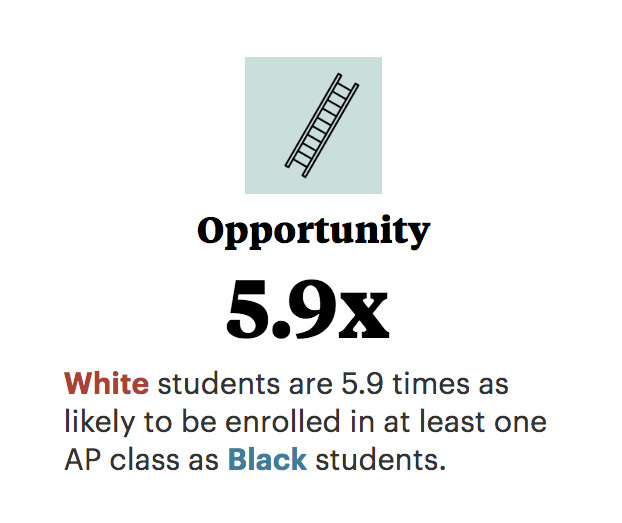
Some schools and districts provide excellent enrichment opportunities for their students. However, not all groups participate at the same rate in these programs. In Charlottesville, for example, white students are nearly six times as likely as their black peers to be enrolled in at least one Advanced Placement course. This trend is not unique to Charlottesville. Across the country, white students are on average about twice as likely as their black peers to participate in gifted programs and advanced courses.
How to report on this:
- Take a look at the opportunity scores in our online database. On most school and district pages, we provide a risk ratio that shows the likelihood that students of certain racial or ethnic groups will participate in Advanced Placement courses or gifted and talented programs. How does your school compare with other schools? How does your district compare with other districts in your state?
- Explore the achievement gaps between white and Hispanic, and white and black students in your school district.

For more than 2,000 districts, we show how many grade levels that verage black and Hispanic students are behind their white peers. The data comes from the Stanford Education Data Archive (SEDA). Interview school and district officials about why the gap exists. Look up your district’s performance on state exams over time, and if possible, obtain data disaggregated by race and income level.
- Investigate how students are chosen for gifted and talented programs in your district. Districts vary in the criteria they use to identify students as gifted, from early childhood testing to teacher and parent recommendations. Do parents of all racial and ethnic backgrounds feel that their children have equal access to the gifted programs? Is the identification process giving students of all backgrounds a fair shot at the gifted program?
- Look up the academic requirements for higher level courses in the district, including Advanced Placement courses. Some schools require students to obtain a teacher’s approval before taking honors or AP courses, which may limit students of color from access to higher-level classes that they may need for admission to a selective college. Interview students about their experiences trying to enroll in advanced classes.
2. Black students nationally bear the brunt of punitive discipline in schools, which may spur some of them to drop out, pushing them into what sociologists call the “school-to-prison-pipeline.” Does this affect your local schools?
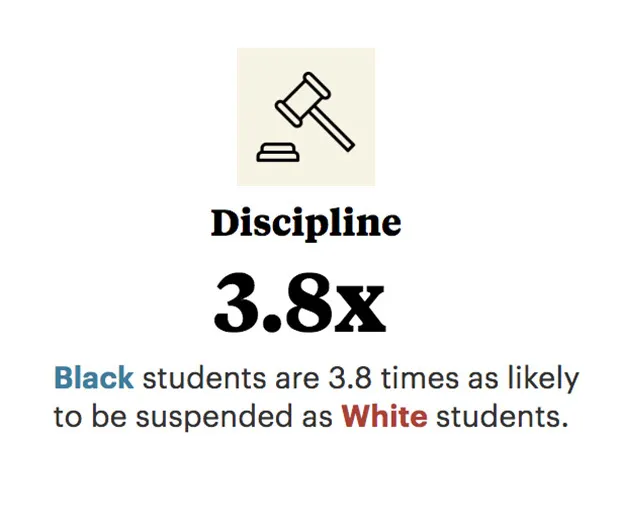
Across the country, black students are about four times as likely as white students to be suspended out of school, according to ProPublica’s analysis of federal data from 2015-2016. In Bryan, Texas, for example, black students are nearly four times as likely to be suspended as their white peers.
How to report on this:
- Take a look at the discipline scores in our online database On most school and district pages, we provide a risk ratio that shows the likelihood of certain racial or ethnic groups of students to be suspended out of school. How does your school compare with other schools? How does your district compare with other districts nearby or across your state?
- Explore racial disparities in the use of other disciplinary methods across schools in your district. In our Miseducation database, you can look up a number of other discipline measures, including the total number of students who received in-school and out-of-school suspensions, the total number of expelled students and the total number of students referred to law enforcement. How do the schools that predominantly serve students of color compare with schools that serve few?
- Research school discipline policies at your school and district. Districts differ in what kind of punishment they allow schools to administer. For example, in DeSoto County, Mississippi, corporal punishment is permitted, whereas just across the state border, in Memphis, Tennessee, corporal punishment hasn’t been used in more than a decade. What are your district’s policies on suspension, expulsion and corporal punishment? How did your district develop its disciplinary policy? Are there rules that may affect one racial or ethnic group of students more than another?
- Look into the relationship between your school district and local law enforcement. Many school districts work with local police departments to staff schools with trained police officers. How much is your school district spending on law enforcement? Does your district have more security workers than behavioral support staff?
- Interview students about their experience with school discipline. Find students who are currently enrolled in school, and those who have dropped out. Interview children at the local juvenile justice facility or young adults at the local jail about how education inequalities may have played a role in their incarceration. Have they or their peers received harsh discipline for minor offenses? How does discipline affect a student’s ability or desire to get a good education and stay in school?
3. Dozens of school districts across the country are under school desegregation orders with federal agencies or courts, dating back as far as the 1960s. Investigate how segregated your district is today.
Just because a district has been under a desegregation order for years or decades may not mean that it has achieved meaningful integration. For example, Jefferson County School District in Alabama has been under a court-mandated desegregation order since 1965. According to our dissimilarity index, the district remains highly segregated. And in the past few years, a mostly white town within Jefferson County attempted to secede from the district in an effort to resegregate the county’s schools.
How to report on this:
- Find out if your district is under a desegregation order or plan. Take a look at ProPublica’s desegregation order database to see if your school district is operating under an open order. In Miseducation, we have flagged schools that reported to the federal government that they are under a desegregation order.
- Look up your district’s opportunity and discipline scores in Miseducation. In districts that are currently under a desegregation order, are students of color more likely to be disciplined? Are white students more likely to participate in gifted programs and enroll in advanced courses? If so, do these disparities violate the order, or indicate a gap in the plan?
- Using open record laws, request documents related to the desegregation order. Ask the district for any documentation that illustrates the district’s integration process. Interview the administrator who is responsible for increasing equity within the district. Request several years of data from the district on enrollment, testing and graduation rates, disaggregated by race and ethnicity.
- Explore your school district’s history of segregation. Even though the nation’s schools were required to desegregate after 1954’s landmark Supreme Court ruling, Brown v. Board of Education, many districts resisted integration for years. Research how your district responded to the ruling and what its policies were. Interview families about the integration process and whether they view it as successful.
4. Hundreds of school districts across the country are under investigation by the U.S. Department of Education’s Office for Civil Rights. Do your own investigation into these districts.
The Trump administration is less likely than its predecessor to regard racial disparities in school districts as an indicator of civil rights violations. For example, for years, the federal government investigated why black students in Bryan, Texas, were almost four times as likely as white students to be suspended. Over the course of the inquiry, federal investigators dug up at least 10 instances where black students received harsher punishment than their white peers for the same behavior. But after Betsy DeVos took over the Education Department, the investigation was closed with no findings of wrongdoing. The Education Department did not respond to ProPublica’s questions about the Bryan case.
How to report on this:
- Look up your school district in ProPublica’s database of civil rights investigations. We made a news application that allows you to see if your school district has recently been investigated or is currently being investigated for civil rights violations. What is your school being investigated for? If there is a recent or current investigation into your school district, reach out to the district administrators and ask for more information.
- File a open records request to get information on the investigation from the Office for Civil Rights as well as the district. If the district does not want to give you information about a federal investigation, you can file a public records request with the district or even the federal government itself.
5. Some schools and districts may be misreporting or misrepresenting data to the federal government. Hold them accountable.
Schools in Newark reported to the federal government that thousands of students had been suspended during the 2015-16 school year. But, according to a report from Chalkbeat, the schools are misreporting suspension data to state authorities, making them look better in state reports that parents consult to learn about the quality of a school.
How to report on this:
- Before starting your investigation, always contact the school or district about its reported data. Most of the data in Miseducation comes from the U.S. Department of Education’s Office for Civil Rights. Schools are required to report accurate data to the department every two years, but sometimes schools and districts make technical mistakes in filling out the survey, and therefore it’s crucial to ask districts about their data before diving into an investigation.
- Is a school reporting zero students in a category? Ask why. Sometimes the data paints a picture that is just too good to be true. For example, the three largest school districts in the country — New York, Los Angeles and Chicago — all incorrectly reported using restraints on zero students to the federal government during the 2012-13 school year. So we wrote a story about it.
- Interview students and parents about whether they think this data is accurate. Ask students, parents and community members if they think the reported data accurately reflects their schools and districts.
How We Got and Prepared the Data
Most of the data in our interactive comes from the Civil Rights Data Collection (CRDC), which is administered by the U.S. Department of Education’s Office for Civil Rights. The department collects data every two years from all schools and districts across the country on a range of topics from Advanced Placement enrollment to suspension rates. The most recent data release, and the one displayed in our interactive, covers the 2015-16 school year. All public schools and districts are required to report data to the department. Many of the fields are broken down by race and ethnicity, providing a snapshot of inequities across the nation’s schools. The CRDC data was used as the master list for all schools and districts to be included in the interactive. Read more about the other data sources here.
Caveats
As most of our data comes from a federal survey, schools may have reported their data incorrectly, as with any self-reported survey. Though districts are required to ensure the accuracy of their data, some may still report incorrect figures. The federal government attempts to identify and look into anomalies before releasing the data to the public, and the office may occasionally releases updates. We intend to update the data in our interactive shortly after updates or changes. Read more about the limitations of our data here.