


This year at ProPublica, we’ve paired computer modeling with traditional reporting to explore questions around viral outbreaks: What causes them and what can be done to prevent the next big one?
One of the most feared diseases is Ebola, which kills about half the people it infects and has shown that it can pop up in unexpected countries such as Guinea. The virus jumped from a wild animal to a human there in 2013, leading to an epidemic that ultimately left 11,000 dead around the globe.
Researchers studying how outbreaks begin have learned that deforestation can increase the chances for pathogens to leap from wildlife to humans. Jesús Olivero, a professor in the department of animal biology at the University of Malaga, Spain, found that seven Ebola outbreaks, including the one that started in Meliandou, Guinea, were significantly linked to forest loss. We found that, around five of those outbreak locations, forests had been cleared in a telltale pattern, increasing the chances that humans could share space with animals that might harbor the disease.
We wondered: Could we use what we learned about these locations to find places that had not yet experienced outbreaks but could be at risk for one? Were there places where Ebola could emerge that look a lot like Meliandou did in 2013?
With the help of epidemiologists and forest-loss experts, along with one of ProPublica’s data science advisers, Heather Lynch, professor of ecology and evolution at Stony Brook University, we developed a machine-learning model designed to detect locations that bore striking similarity to places that had experienced outbreaks.

NIGERIA
DEMOCRATIC
REP. OF CONGO
Atlantic Ocean
All model candidates
Flagged candidates
The result? Out of a random sample of nearly 1,000 locations across 17 countries, ProPublica’s model identified 51 areas that, in 2021 (the most recent year that satellite image data on forest loss was available at the time of our analysis), looked a lot like places that had experienced outbreaks driven by forest changes.
These locations fell within forested zones in Africa that have wildlife believed to be carrying Ebola; that had recently experienced extensive forest fragmentation (that is, clearing of forests in many small, disconnected patches); and that have a population baseline that could sustain an outbreak if one emerged. To our surprise, 27 of the locations were in Nigeria, where an Ebola outbreak has never started.
After reviewing our findings, one of the researchers we consulted, Christina Faust, a research fellow at the University of Glasgow, Scotland, called the analysis a “best estimate of risk,” in light of the many outstanding questions about how Ebola arises.
“You’ve clearly identified ecological features that are consistent across the spillover locations,” Faust said. “And these ecological conditions and human conditions are cropping up in other places. And given that we don’t know so much about the reservoirs, I think this is our kind of best ability to do a risk analysis.”
Why Random Forests
This model was developed out of an earlier analysis we published in February. We used satellite imagery and epidemiological modeling to show that villages where five previous Ebola outbreaks occurred are at a greater risk of spillover happening today, including Meliandou, Guinea, the site of the worst Ebola outbreak in history.
In five locations where outbreaks had occurred, we found a distinctive pattern in how forests erode over time. At the highest level of fragmentation, the areas where humans and virus-carrying animals might interact, or “mixing zones,” are largest, and risk is at its peak. But after the forest becomes so eroded by human activity that it can’t sustain wildlife anymore, risk decreases.
That analysis focused on the research led by Olivero and an epidemiological model created by Faust and her colleagues that tracked how spillover risk changes as forests become increasingly fragmented. But there was also other intriguing research on the link between land use and Ebola spillover that caught our attention.
One paper, by a team led by Maria Rulli at the Politecnico di Milano, Italy, found a relationship between increased forest fragmentation over time and Ebola outbreaks. We came across a couple other papers that mapped out where Ebola is likely to exist in wild animals, including one by Olivero himself.
As part of the first project, we created a data set of ecological characteristics from satellite imagery. We were curious if some of the factors, like the number of forest patches or proportion of mixing zones around those patches, could shed additional light on how susceptible a location could be to disease spillover.
Months in, we asked ourselves, could we combine the 23 environmental and population characteristics and what we learned from work by Olivero, Faust and Rulli into a single model? Could such a model reveal new insights into the conditions related to forest change that make it possible for Ebola to jump from animals to humans?
On the advice of Lynch, our science adviser, we started by looking for any clear patterns or clusters among the characteristics.
But after squinting at lots of tiny scatter plots, nothing jumped out. This wasn’t entirely unexpected, because we had only seven outbreaks to compare. When the number of characteristics far outnumbers the events you’re interested in, it can be hard to tease out clear relationships. So Lynch suggested something straight from her own research playbook: decision trees and random forests.
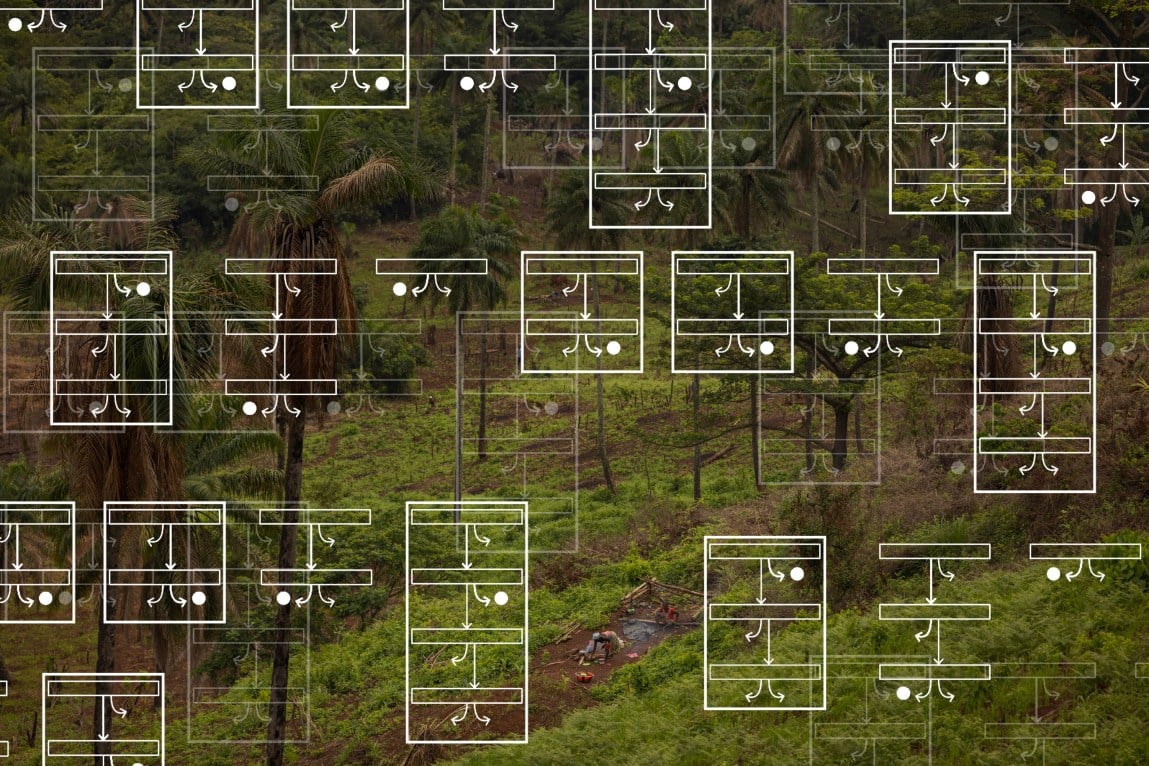
Decision trees, Lynch explained, are machine learning algorithms that create chains of binary decisions to help distinguish groups from one another. We hoped they could help us find places that looked a lot like locations where Ebola outbreaks had occurred. These trees — not to be confused with the leafy trees in our forest data — are useful because they can sort and cluster data based on combinations of characteristics that might not be obvious when considering each individually, and flag potential matches.
Decision trees helped us figure out which population and forest characteristics best explain the differences between locations we’re interested in, and all others.

Location type
we’re interested in
Other types of locations

Location type
we’re interested in
Other types of locations
Here’s an example of one decision tree generated by our model.

Has forest fragmentation increased by more than 23 percentage points?
If not, proceed to next decision
If so, flag location
Did the number of forest patches increase by more than 440?
If so, discard location
If not, proceed
Was the total forest area in 2019 less than 123,147 hectares?
If not, proceed
If so, discard location
Was the total forest area in 2021 more than 123,451 hectares?
If so, discard location
If not, flag location

Has forest fragmentation increased by more than 23 percentage points?
If so, flag location
If not, proceed to next decision
Did the number of forest patches increase by more than 440?
If not, proceed
If so, discard location
Was the total forest area in 2019 less than 123,147 hectares?
If so, discard location
If not, proceed
Was the total forest area in 2021 more than 123,451 hectares?
If so, discard location
If not, flag location
Most importantly, they’re easy to understand. Unlike many machine learning models, it’s easy to pop the hood on a decision tree and examine the choices made at each step. But easy doesn’t mean unsophisticated. Many decision trees, each with random, slight differences, can be combined into something called a random forest, which aggregates the results of multiple decision trees. Random forests are a popular and versatile technique that has been used widely in academia and journalism.
Computers can generate many decision trees, each with slight differences. Together, they make up a random forest.
Any single location that is flagged by a majority of trees in a random forest is considered a location of interest.


We created a random forest made up of 1,000 trees. If a location was flagged by the random forest, then it was classified as similar to locations where Ebola outbreaks had been linked to forest loss, and reviewed by us.
Choosing Data
Our ultimate goal was a model that could figure out which characteristics were distinctive in places that had experienced Ebola outbreaks. So we created three buckets of data: outbreaks linked to forest loss, outbreaks that had other origins and random places where outbreaks never happened.
Collecting the first two buckets was easy: the seven Ebola outbreaks previously linked to forest loss by Olivero and his collaborators went into one. The rest of the outbreaks since 2000 (the earliest year for which forest loss data from Hansen/Global Forest Watch is available) went into the other.
For the third bucket, we had lots of options. We started with a database of villages and hamlets in 28 countries. Then, we found which of them overlapped with Olivero’s data that maps where conditions are favorable for wild animals to harbor Ebola. In all, we had 11 million locations to examine.
It was unfeasible to query all 11 million, so we collected a random sample of 50,000 and collected population statistics for each. We then determined which of the 50,000 locations were at least 100 kilometers, about 62 miles, away from the outbreaks already in our two buckets. Finally, we narrowed the sample to villages and hamlets where the human population was within the range of populations in our outbreak buckets, because they might interact with the forest in similar ways; for example, for firewood or hunting. The populations couldn’t be too small, either — spillover events require, by definition, human hosts to jump into.
Our last step was to filter for locations similar to those in our second bucket. In other words, these locations had characteristics that could sustain an Ebola outbreak, maybe even due to a spillover event, but for reasons unrelated to forest loss. We selected 21 of those random locations for our third bucket of data.
For all 35 locations, which we refer to as our training data, we calculated 23 different characteristics about forest change and population using a variety of data sources.
Seven locations used as training data were outbreaks tied to forest loss.


The other locations fell into two buckets: outbreaks not tied to forest loss, or locations where outbreaks were never recorded.

7 locations where outbreaks were not linked to forest loss
21 locations where outbreaks were never recorded

21 locations where outbreaks were never recorded
7 locations where outbreaks were not linked to forest loss
Click to show technical details.
We collected forest loss data from the Hansen/Global Forest Watch database. For all locations, we used a database called GRID3, which extracts places where humans live from satellite imagery and classifies them into three types: “built up areas” or cities, “small settlement areas” (villages) and “hamlets” (a few houses or structures). We restricted our query to “small settlement areas” and “hamlets” because all but one of the locations in our first bucket of data were nearest to those two types of settlements. Furthermore, because we were looking for spillovers linked to deforestation, we were most concerned about people living in direct proximity to forests.
We identified the hamlets or villages nearest to all known outbreaks dating back to 2000.
It’s unlikely an area could be susceptible to Ebola if favorability is less than 0.3, so we limited our set of candidate locations to those where favorability was at least 0.3. We also limited our query to locations with population statistics within range of the seven outbreaks of interest: a minimum population of 10, a median population of at least 10 and a total population of at least 10,000 for all settlements within a 20 kilometer, about 12 mile, radius of the settlement in question.
For all training locations, we also calculated fragmentation metrics using a Python module called PyLandStats to generate a set of fragmentation and edge statistics, and the same custom edge detection code from our earlier work. This code determines how much mixing zones within a 20 kilometer radius around each settlement had grown between 2000 and the year of outbreak, and between 2000 and two years before the year of the outbreak.
For the data in the third bucket, instead of an outbreak year we used a random year between 2003 and 2020, reserving data from 2021, the most recent year for which data is available, for testing.
Training and Validating the Model
With training data in hand, we set about trying to get the model to find insightful patterns. It’s a real possibility, especially when the input data is limited, that machine learning models will find patterns where there actually are none. This is called overfitting; think of it as a computer interpreting polka dots as a connect-the-dots game.
To avoid overfitting, we trained multiple random forest models, each time withholding some of the data. This is a common strategy in ecology, where data can be scarce and it’s important to make sure that a model is not overly influenced by the idiosyncrasies of any one data point. In our case, Ebola is such a rare disease that excluding one of seven outbreaks in each training round allowed us to see if any of them were disproportionately affecting the models.
The results from each training round also gave us a better idea about which of the 23 characteristics were most important. Only four characteristics were ranked as important across all training rounds: the number of patches the forest is divided into, the forest area at two points in time and changes in forest fragmentation.
This set of characteristics was exciting, because it confirmed that key concepts from the work by Olivero, Faust and Rulli could be combined into a single model.
Click to show technical details.
We used the sklearn Python package’s implementation of random forests, RandomForestClassifier.
Our strategy of withholding some data in each training round is commonly referred to as leave-one-out cross-validation (LOOCV). In each round of model training and LOOCV, one of the seven outbreaks linked to forest loss from the first data bucket was selected to be left out of training. A random forest consisting of 1,000 decision trees was trained on the six remaining outbreaks linked to forest loss and a random sample of 24 out of the 28 locations in the second and third data buckets, referred to as “null set” locations. Then, the forest was validated on the outbreak that was left out and the four remaining null set locations.
We ran 10 rounds of model training and LOOCV.
We performed feature selection and examined the importance of each covariate in the random forests produced during training via the built-in attribute feature_importances_ produced by the RandomForestClassifier estimator. For each set of 10 training rounds performed for each outbreak left out, we identified the covariates that were among the top five in all rounds. The union of those covariates across all sets of training rounds was used in the final model.
We evaluated training results using the classic metrics of accuracy, precision and sensitivity. Because Ebola outbreaks caused by spillover events with links to forest loss are relatively rare, we prioritized detection of true positives when performing feature selection.
Before we ran with these results, though, we wanted to gut-check one last possibility: that whatever pattern our model had found was too general. Sure, maybe we’d built something that identified a handful of shared traits among seven outbreaks, but perhaps our approach would always find key characteristics among a small number of data points.
To test this hypothesis, Lynch proposed something called, intriguingly, a “garbage model.”
Think of an English-Spanish dictionary, except the word pairs are all shuffled — “cat” is linked with “perro,” instead of “gato.” Using the dictionary to translate an English sentence would result in a totally nonsensical Spanish sentence.
Shuffling our data, Lynch said, should result in similarly nonsensical classifications of the data withheld from training. If not, then our approach was likely too general. But if the garbage model generated garbage classifications for the withheld data, then we could have some reassurance that whatever patterns our actual model found were genuine.
We tried it and — out came basura, as expected. It was time to create the final model.
Testing the Model
Our final model only used the four most important characteristics of the nearly two dozen we’d started out with: how much patchier the forest had become in the two years leading up to an outbreak, how much bigger the mixing zones had gotten in that time, the amount of total forest in the year the outbreak happened and the amount of forest two years before that.
Finally, it was time to test the model by showing it completely new places and then asking which of them look like the set of outbreaks in the first bucket.
We took another random sample of approximately 1,000 places from the 50,000 previously sampled random set of settlements. Calculating fragmentation statistics in Google Earth Engine is time consuming — it took us about a week to process 1,000 locations. Collecting data for more locations would not have been feasible.

Let’s see how the test locations might be sorted by a single decision tree in our random forest model.
Not all test locations shown
First, the tree checks changes in fragmentation.
In 28 out of 995 test locations, fragmentation has increased by more than 23 percentage points. The tree identified this as an interesting feature, so it flags these locations.
0
20
km
Mixing zones created between 2019 and 2021 around a village in Oyo, Nigeria
Meanwhile, all remaining points continue through the tree.
Next, the tree checks the patchiness of forests.
During training, it found that outbreaks tied to forest loss had only a moderate amount of new patches in recent years, less than 440 new forest patches in 2021 than there were in 2019.
But 171 out of the remaining 967 test locations had an excessive number of new patches, so they are discarded.
Not all discarded locations shown
New patches created between 2019 and 2021 around a village in Ituri, Democratic Republic of Congo
Now the tree checks the total forest area in 2019 in the remaining locations.
During training, the tree found that locations with less than 123,147 hectares of total forest area in 2019 are likely not of concern.
It turns out that all 796 remaining locations fell below that threshold. They are discarded as well.
Forest in 2019 around a village in Ituri, Democratic Republic of Congo
There’s actually one remaining step in this particular decision tree about total forest area in 2021, but there are no more locations to test.
Out of 995 test locations, this decision tree flagged 28 locations and discarded 967.
Click to show technical details.
The sample of test locations had the same population criteria described above for selection of locations for the second bucket of training data.
However, we restricted our test locations to places where the favorability for Ebola, as calculated by Olivero, was between 0.44 and 0.95. This was the favorability range observed for the locations in our first two buckets of training data, locations where Ebola has previously occurred.
We used the reduceToVectors and buffer functions in Google Earth Engine to calculate the number of patches and amount of edge generated by those patches around the locations created between 2001 and 2019 and between 2001 and 2021, then calculated the delta in number of patches, edge and other statistics using Postgres.
Out of nearly 1,000 test locations, we found that 51 were consistently flagged. About half of the locations were in southwest Nigeria. Sixteen were in the Democratic Republic of Congo, and the remaining handful were in Ghana, Burundi and Benin.
Given that a spillover-induced outbreak of Ebola has never been recorded in Nigeria, we were surprised by the results. But a literature review revealed other papers that warned of the potential for Ebola spillover events in Nigeria. These papers, plus the locations flagged in the Democratic Republic of Congo — the site of the most recent Ebola outbreak with confirmed links to a spillover event — gave us the confidence to hit pause on all the coding and modeling to do some reporting.
You can read about it in our story.


Most Read


Support Independent Journalism:
As a nonprofit newsroom, we rely on donations from individuals like you to fuel our work. Your support today will directly fund investigations that shine a light on urgent issues: corporations prioritizing profits over public safety, health insurers denying coverage to patients, unintended consequences of new laws and more.