


Google Refine (the program formerly known as Freebase Gridworks) is described by its creators as a “power tool for working with messy data” but could very well be advertised as “remedy for eye fatigue, migraines, depression, and other symptoms of prolonged data-cleaning.”
Even journalists with little database expertise should be using Refine to organize and analyze data; it doesn’t require much more technical skill than clicking through a webpage. For skilled programmers, and journalists well-versed in Access and Excel, Refine can greatly reduce the time spent doing the most tedious part of data-management.
Other reasons why you should try Google Refine:
- It’s free.
- It works in any browser and uses a point-and-click interface similar to Google Docs.
- Despite the Google moniker, it works offline. There’s no requirement to send anything across the Internet.
- There’s a host of convenient features, such as an undo function, and a way to visualize your data’s characteristics. For example, check out this guide on how to use it for geocoding addresses.
Download and installation instructions for Refine are here.
This tutorial covers the same ground as this screencast by Refine’s developer David Huynh (the other two videos are here):
The Basics of “Messy Data”
“Messy data” refers to data that’s riddled with inconsistencies, either because of human error or poorly designed record systems. So, a column that contains dates may hold values such as “12-10-2004”, “May 9, 1989”, and “12/4/10.”
These consistences can wreak havoc when trying to perform analysis on the data, so they have to be addressed before starting any analysis.
Badly formatted dates are such a common problem that most modern software, such as Excel, has been programmed to (usually) handle all the different date formats.
But there’s no easy conversion standard for other kinds of data, such as names. If you wanted to get all rows with the name “Tina Fey,” you’d miss the rows that had “TINA FEY” and “Fey, Tina.“ Even differences in capitalization throws off a computer’s basic comparison routine.
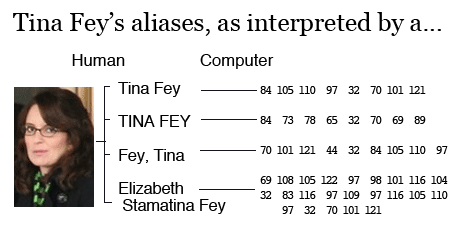
Photo by daniel.gene
It’s easy enough to write a piece of software that ignores capitalization and punctuation. It takes a little more thinking to have that software ignore middle initials and names if they exist in certain rows but not others.
To handle nicknames, you could write up a long list of translations, such as “Jake”=”Jacob” and “Sam”=”Samuel” (or “Samantha,” for that matter).
You could also deal with typos by having your code allow for differences of one or two letters when matching names. But to be certain the computer doesn’t match “Dan Smith” and “Don Smith,” you’d have to write a way to flag ambiguous matches.
You can see how doing all of this would be tedious. Enter Google Refine, which does all of the above and more.
How We Used Refine in “Dollars for Docs”
For the Dollars for Doctors project, one of our initial inquiries was to find out who the top-paid doctors and why they were held in high regard by the industry. This became the crux of our first stories, as we discovered problems in how companies screened doctors they hired for promotional work.
In our series of technical guides, we detail how we converted the companies’ payment records from unsortable PDFs to spreadsheets. While this allowed us to find top-paid doctors per company, we wanted to know the total they earned from all the companies.
But even within the same company’s records, the names of payees varied. Some companies included middle names and suffixes, others didn’t. Born names also made simple comparisons tricky.

So before attempting any calculations or analysis in Excel or Access, we used Google Refine.
Starting a Project
You can download Refine’s one-step installation package here. After Refine is installed, clicking on its application icon will pop open your default web browser (I’ve had the best performance with Google Chrome). Start a new project by opening a delimited-text file or Excel spreadsheet.

Your data as viewed through Refine
Right away you’ll see that the data is arranged in a familiar spreadsheet format. Clicking on an individual cell lets you edit it. Clicking on a column header brings up a submenu of operations, including sorting.
Faceting
Refine’s faceting feature allows us to summarize the unique values in a column. The easiest way to see its effect is to try it. Clicking on the companies.name column header brings up a pop-up menu, from which we choose Facet -> Text Facet.

Click on the column-header to bring up submenus.
Now check out the left panel. Refine has listed the seven different company names found in that column, as well as the number of records per company. This is a very convenient way to see if there are any unexpected values in a column.

Faceting the companies column lets us see the different companies that exist in our data and how many records belong to each.
If some of the entries had the company “Merck” misspelled as “Merk”, both would’ve shown up in the left panel. Clicking Remove All remove the company name faceting.
We will be faceting the records’ doctor names in the full_name column to see how many variations exist. We will then use Refine’s clustering feature to condense all the variations (and misspellings) of a name into a single identity, which allows us to find all the records associated with that name, and then add up the payment amounts.
Read more about clustering from Refine developer David Huynh.
Refine can automate the clustering process, and make it easy for you to do it by hand, but there’s always room for error. For proofreading purposes, we want to keep track of what was originally in the full_name column, so let’s duplicate the column by clicking on the column header, then Edit Column->Add column based on this column.
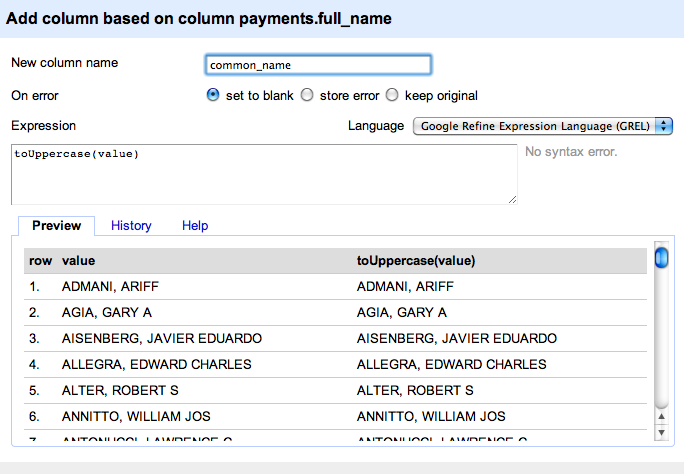
Add a column that duplicates (and upper-cases) the values in the full_name column
Refine supports the several programming languages for transforming or calculating values in a column. For our purposes, we’ll just populate our new column, common_name, with the results of toUppercase(value), which uppercases the text in the corresponding full_name cell.

The new column, common_name
Now we facet the common_name with the Facet->Text Facet command. Refine’s left panel is now populated with all the variations of names found in the records.
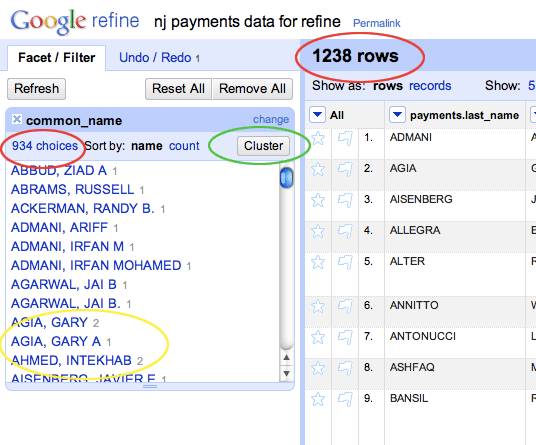
The common_name column faceted.
Notice (circled in red) how the number of total rows (1,238) differs from the number of choices (938). The latter number represents the unique names found among the 1,238. You can see in the list, for instance, two names (circled in yellow) that have two repetitions each.
Now, we click on the Cluster button to begin the relatively painless process of clustering these names.
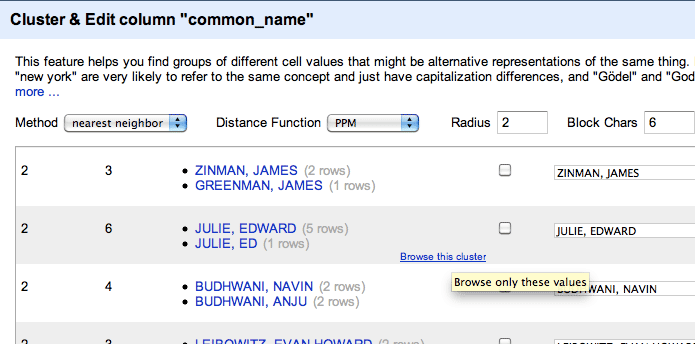
Clustering
Refine gives you five algorithms for guessing the similarity of names. It starts you off with the fingerprint function, which uses the strictest – and safest – formula. Fingerprint assumes that two names have identical alphabetical characters and spacing, regardless of capitalization and punctuation.
So, “Johnny R. Cash,” “JOHNNY R. CASH,” and “Cash, Johnny R,” when translated by the fingerprint function, all end up being equivalent to “cash johnny r.”
Refine conveniently lets us click on which of the three variations you want to settle on. Or you can choose Select All, and Merge Selected and Re-Cluster, and Refine will make the choices for you. With the fingerprint function, you can feel pretty confident that the names it clusters together are indeed equivalent.

The fingerprint clustering function
You can read the nitty gritty on all of Refine’s clustering functions here. They progress from stricter to looser. For example, the double-metaphone function groups names by how they sound. This catches variations caused by typos, such as “Bobb Woodword” and “Bob Woodward” that stricter formulas would consider to be different. However, it also considers “Samir” and “Semir” to be equivalent. So clustering isn’t an automatic process, but at least Refine makes it as painless as possible.
The most lax algorithm, PPM (short for Prediction by Partial Matching), can match up particularly different names, though this means you have to put more effort in weeding out false positives.

First pass with PPM clustering
The first pass with PPM appears to be all real matches, matching names where either the doctor’s middle name or just middle initial were included.
It’s pretty easy to write a database command to match entries where first name, last name, and the first letter of the middle name are equivalent.
But since we were dealing with seven different companies with seven different ways of recording names, we didn’t know that beforehand. Some companies may include the middle name in the first name field. Others may have a separate column for it, and others may omit the middle name entirely.
So Refine not only gives us a quick way to cluster names, but does it without needing to know beforehand the actual details of the data format. The full_name column, from which the common_name column is derived from, could consist of entries that are “LAST_NAME, FIRST_NAME” or “FIRST_NAME MIDDLE_NAME LAST_NAME”; Refine doesn’t care.
The Net Size
If we increase the radius of the PPM function to 2 (the larger the number, the wider the net; read the technical details here), we start to see where Refine’s algorithm makes inaccurate guesses:

Looser PPM clustering
The looser algorithm catches the likely match of Cathleen Mullarkey and Cathleen J. Mullarkey-Desapio. However, it also guesses that “Joseph N Gritzzanti” and “Joseph N Ranieri” are the same person.
In cases where it’s ambiguous, Refine makes it easy to examine the cluster yourself. In the example below, Refine has grouped “Edward Julie” and “Ed Julie” together. Is “Ed” short for “Edward,” or could it be an “Edmund”, and thus, a completely different person?
Move the mouse pointer over the row brings up the Browse this cluster option.
Hover your mouse over a clustered entry to bring up the option to get a closer look.
Clicking it pops up a new browser tab with just the entries from the potential cluster. Here, we can see that Dr. “Ed” Julie shares the same city and consulting firm as another record that lists his name as “Edward,” so it seems likely the records refer to the same person.
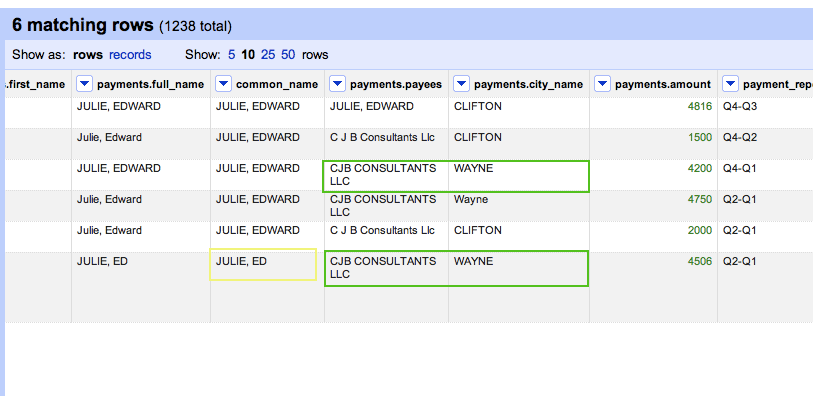
Inside the cluster
Refine allows you to export to a delimited format, including Excel spreadsheet, where you can do your math and graphing.
And to answer our original question – which doctors made $100,000 or more through drug company work – we simply group entries by the common_name column and sum up the amounts. You can see our findings here.
It’s important to point out that even after using Refine, we researched each of these identities to confirm that it was a single person. In at least one case, there was a father and son, with identical names, who were both doctors in the same geographical area. This research requires time and labor beyond what computer analysis can provide. The rest of the Dollars of Docs database keeps the payment records separate, as originally listed by the companies.
Refined Journalism
A major time sink in data cleaning is designing a way to easily pore through the results list and eliminate false positives and find missed matches. Refine has this built in, and reporters with no programming experience can jump in and help clean and proofread.

Real-world data never comes as clean as we’d like. And the tedium and difficulty of poring through messy data stifles our ability to see trends and leads. Refine’s a great tool for speeding up the cleaning process and for getting a clear view of your data, no matter your technical aptitude.
You can download Google Refine here.
For a more detailed tutorial, watch Refine developer David Huynh’s excellent screencast tutorials. Also, check out Refine’s Google Group, where Refine developers respond quickly to bug reports and feature requests.
The Dollars for Docs Data Guides
Introduction: The Coder’s Cause – Public records gathering as a programming challenge.
- Using Google Refine to Clean Messy Data – Google Refine, which is downloadable software, can quickly sort and reconcile the imperfections in real-world data.
- Reading Data from Flash Sites – Use Firefox’s Firebug plugin to discover and capture raw data sent to your browser.
- Parsing PDFs – Convert made-for-printer documents into usable spreadsheets with third-party sites or command-line utilities and some Ruby scripting.
- Scraping HTML – Write Ruby code to traverse a website and copy the data you need.
- Getting Text Out of an Image-only PDF – Use a specialized graphics library to break apart and analyze each piece of a spreadsheet contained in an image file (such as a scanned document).


